Chart EUR/CAD Update: Choppy trade - daily studies falling
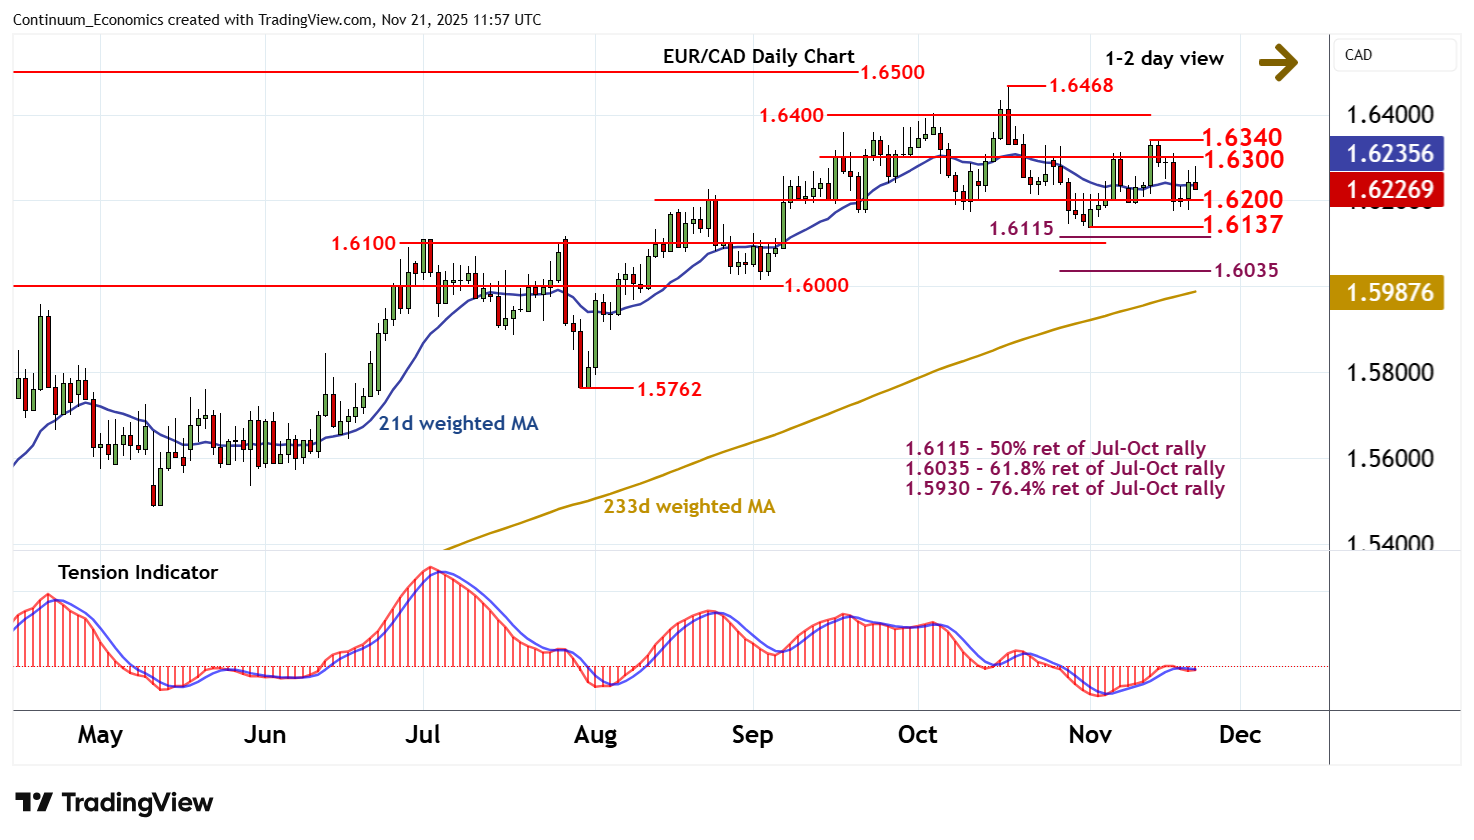
Consolidation around congestion support at 1.6200 has given way to a sharp bounce towards congestion resistance at 1.6300
| Level | Comment | Level | Comment | |||||
|---|---|---|---|---|---|---|---|---|
| R4 | 1.6468 | * | 17 Oct YTD high | S1 | 1.6200 | * | congestion | |
| R3 | 1.6400 | * | break level | S2 | 1.6135~ | ** | 3 Nov (w) low | |
| R2 | 1.6340 | * | 13 Nov (w) high | S3 | 1.6115 | ** | 50% ret of Jul-Oct rally | |
| R1 | 1.6300 | * | congestion | S4 | 1.6100 | * | congestion |
Asterisk denotes strength
11:40 GMT - Consolidation around congestion support at 1.6200 has given way to a sharp bounce towards congestion resistance at 1.6300, before falling back as overbought intraday studies unwind, to currently trade around 1.6225. Both daily stochastics and the daily Tension Indicator are falling, highlighting room for fresh losses in the coming sessions. A break back below 1.6200 will open up critical support within the 1.6135~ weekly low of 3 November and the 1.6115 Fibonacci retracement. Mixed/negative weekly charts could limit any initial tests in consolidation, before fresh losses are seen. Meanwhile, resistance remains at 1.6300 and extends to the 1.6340 weekly high of 13 November. An unexpected close above here would improve sentiment and extend November gains towards 1.6400, where fresh selling interest is expected to appear.