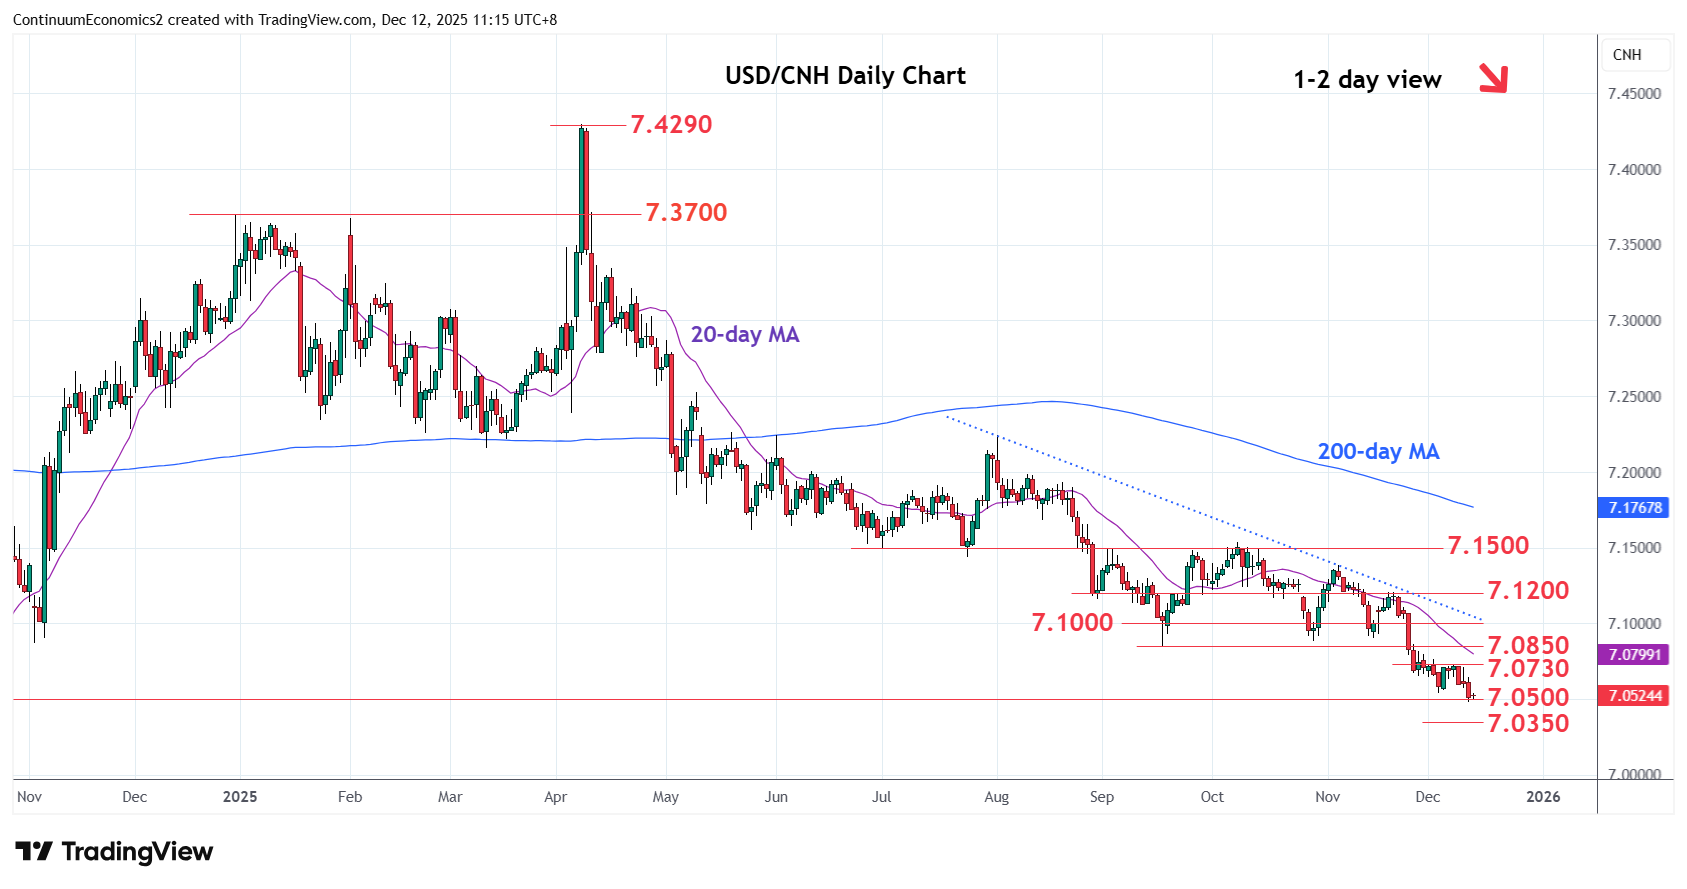
Chart USD/CNH Update: Consolidating test of 7.0500
Consolidating test of the 7.0540/7.0500 area as prices unwind oversold intraday studies
| Level | Imp | Comment | Level | Imp | Comment | |||
|---|---|---|---|---|---|---|---|---|
| R4 | 7.1200 | ** | congestion | S1 | 7.0540/00 | ** | 3 Dec YTD low, congestion | |
| R3 | 7.1000 | * | congestion | S2 | 7.0350 | * | congestion | |
| R2 | 7.0800/50 | * | congestion, Sep low | S3 | 7.0000 | ** | figure | |
| R1 | 7.0730 | * | 8 Dec high | S4 | 6.9710 | ** | Sep 2024 year low |
Asterisk denotes strength of level
03:20 GMT - Consolidating test of the 7.0540/7.0500 area as prices unwind oversold intraday studies. Daily studies are stretched as well and suggest scope for corrective bounce though gains likely to be limited. Break of the 7.0500 level will extend losses from the April current year high and see room for extension to the 7.0350 congestion area from October 2024. Lower still, will see potential to the 7.0000 figure but focus will turn to the 6.9710, September 2024 year low. Meanwhile, resistance at the 7.0730 is expected to cap. Only above here will open up room for stronger corrective bounce to 7.0800/50, congestion and September low.