Published: 2026-02-20T05:11:52.000Z
Chart USD/MYR Update: Consolidating above 3.8960 low
1
Edged up from the 3.8960 low of last week as prices consolidate recent sharp losses from the 4.0760, 5 January high
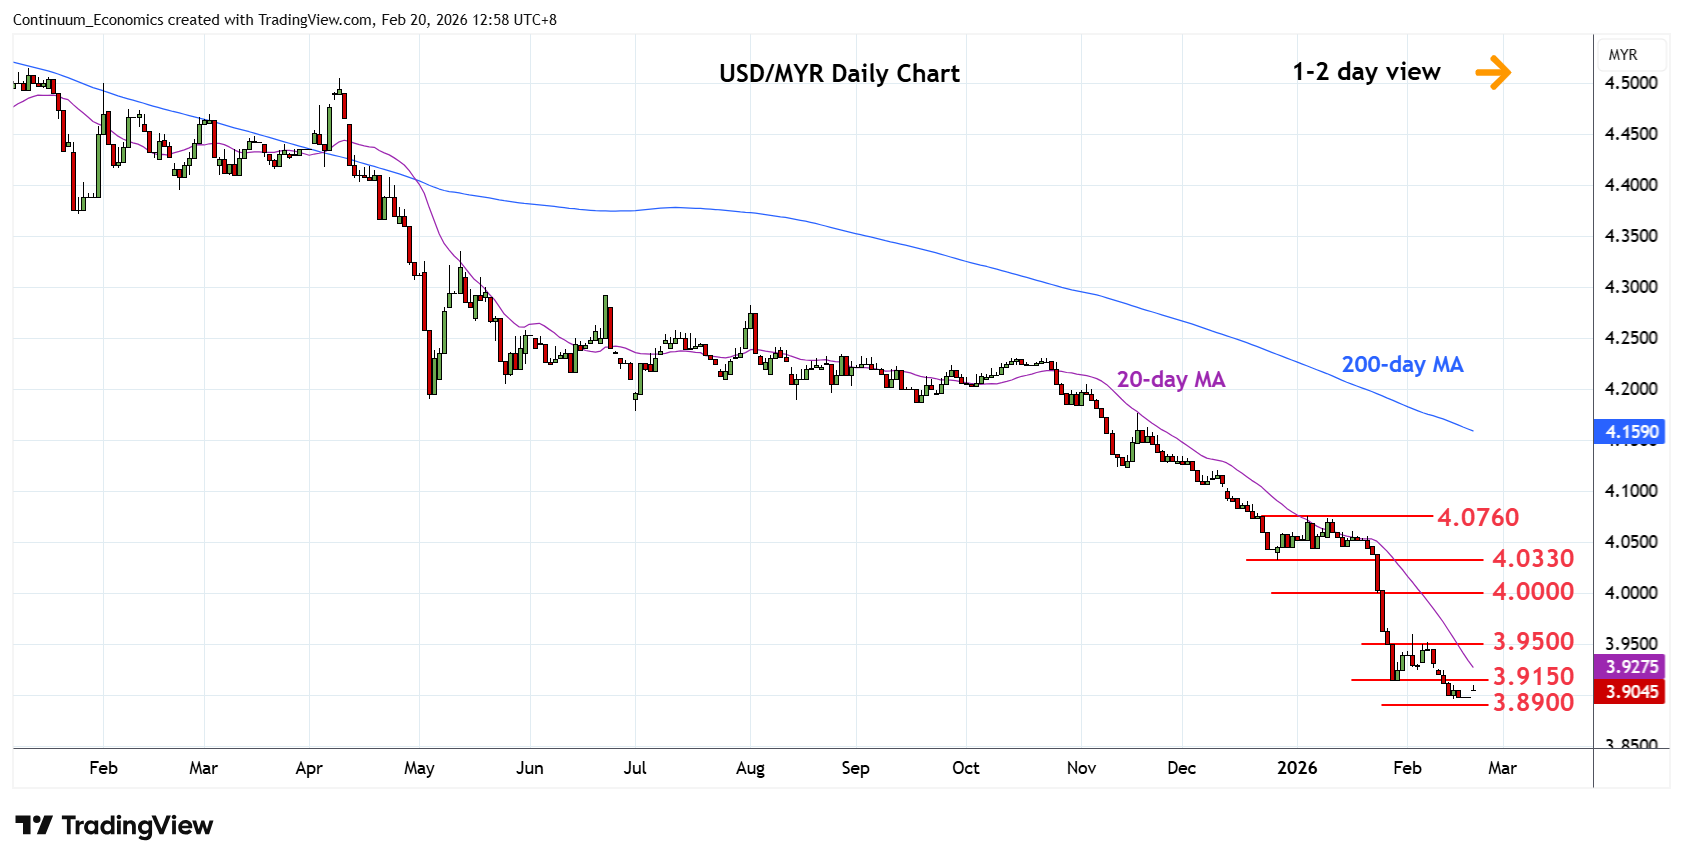
| Levels | Imp | Comment | Levels | Imp | Comment | |||
|---|---|---|---|---|---|---|---|---|
| R4 | 4.0330 | * | Dec 2025 year low | S1 | 3.8900 | * | congestion | |
| R3 | 4.0000 | ** | figure, 2021 year low | S2 | 3.8700 | * | Jan 2018 low | |
| R2 | 3.9500 | * | congestion | S3 | 3.8560 | ** | Apr 2018 year low | |
| R1 | 3.9150 | * | Jan low | S4 | 3.8380 | ** | Apr 2016 year low |
Asterisk denotes strength of level
05:10 GMT - Edged up from the 3.8960 low of last week as prices consolidate recent sharp losses from the 4.0760, 5 January high. Prices are unwinding oversold daily studies and suggest scope for bounce to resistance at 3.9150 and 3.9500 congestion area which are expected to cap. Break, if seen, will open up room for stronger gains to strong resistance at 4.0000 figure. Break of the 3.8960 low will further extend the broader losses from the 2024 year high and see room to 3.8900 figure and 3.8700, January 2018 low.