Continuum Economics
  • Search
  • About Us
  • Buy
  • Invite A Friend
  • My Basket
  • Articles
  • Calendar
  • Forecasts
  • Events
  • Data
  • Newsletters
  • My Alerts
  • Community
  • Directory
  • About Us
  • Buy
  • Invite A Friend
  • My Basket
  • Articles
    • All
    • Thematic
    • Tactical
    • Asia
    • EMEA
    • Americas
    • Newsletters
    • Freemium
    • Editor's Choice
    • Most Viewed
    • Most Shared
    • Most Liked
  • Calendar
    • Interactive
      • China
      • United States
      • Eurozone
      • United Kingdom
    • Month Ahead
    • Reviews
    • Previews
  • Forecasts
    • Forecasts
    • Key Views
  • Events
    • Media
    • Conference Calls
  • Data
    • Country Insights
    • Shadow Credit Ratings
    • Full CI Data Download
  • Newsletters
  • My Alerts
  • Community
    • FX
    • Fixed Income
    • Macro Strategy
    • Credit Markets
    • Equities
    • Commodities
    • Precious Metals
    • Renewables
  • Directory
  • My Account
  • Notifications Setup
  • Administration Panel
  • Account Details
  • Recent Devices
  • Distribution Lists
  • Shared Free Trials
  • Saved Articles
  • Shared Alerts
  • My Posts
Published: 2026-01-22T17:18:22.000Z

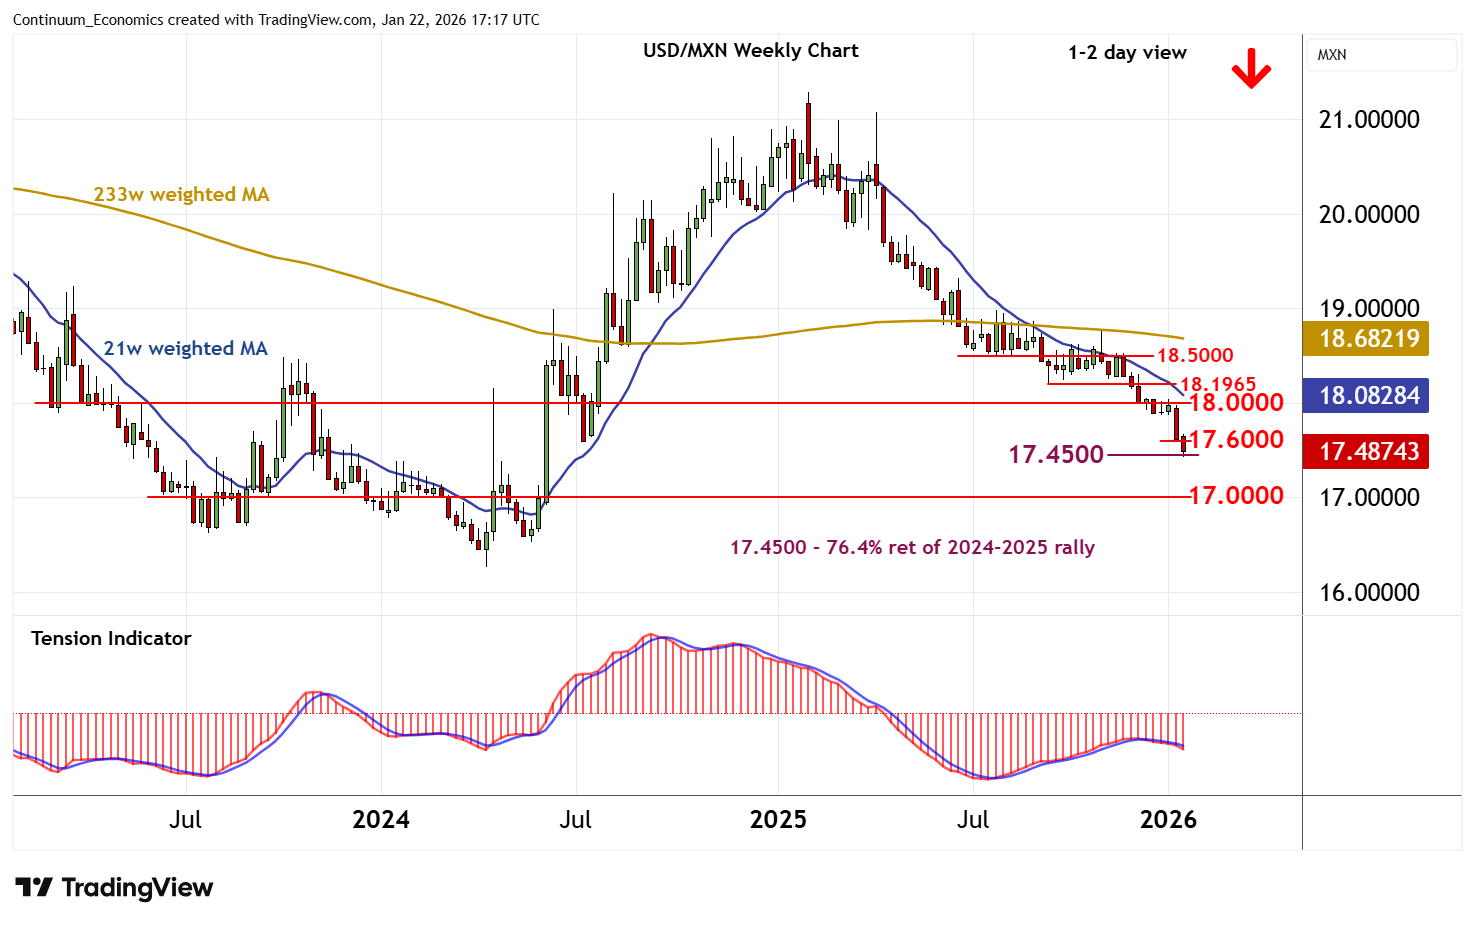
Chart USD/MXN Update: Pressuring strong support at the 17.4500 Fibonacci retracement

-

Anticipated selling interest has extended February 2025 losses to strong support at the 17.4500 Fibonacci retracement

 LevelsImpComment  LevelsImpComment
R418.0000**congestion S117.4500**76.4% ret of 2024-2025 rally
R317.8000*congestion S217.0000**congestion
R217.7000*congestion S316.9150*June 2024 low
R117.6000*congestion S416.7500**congestion

Asterisk denotes strength of level

17:05 GMT - Anticipated selling interest has extended February 2025 losses to strong support at the 17.4500 Fibonacci retracement. Daily stochastics are flat in oversold areas, suggesting potential for consolidation around here. However, the daily Tension Indicator is bearish and weekly charts are also under pressure, highlighting room for deeper losses in the coming sessions. A break beneath here will add weight to already bearish price action and open up a test of congestion support at 17.0000. Meanwhile, resistance is lowered to congestion around 17.6000. A close above here, if seen, will help to stabilise price action and prompt short-term consolidation.

Continue to read the article for free
Login

or

or

Topics
EM-Technical
Technical Analysis
USD/MXN-TA

GENERAL

  • Home
  • About Us
  • Our Team
  • Careers

LEGAL

  • Terms and Conditions
  • Privacy Policy
  • Compliance
  • GDPR

GET IN TOUCH

  • Contact Us
Continuum Economics
The Technical Analyst Awards Winner 2021
The Technical Analyst Awards Finalist 2020
image