Published: 2026-05-13T02:57:18.000Z
Chart USD/THB Update: Consolidating with 32.50/32.20 area
1
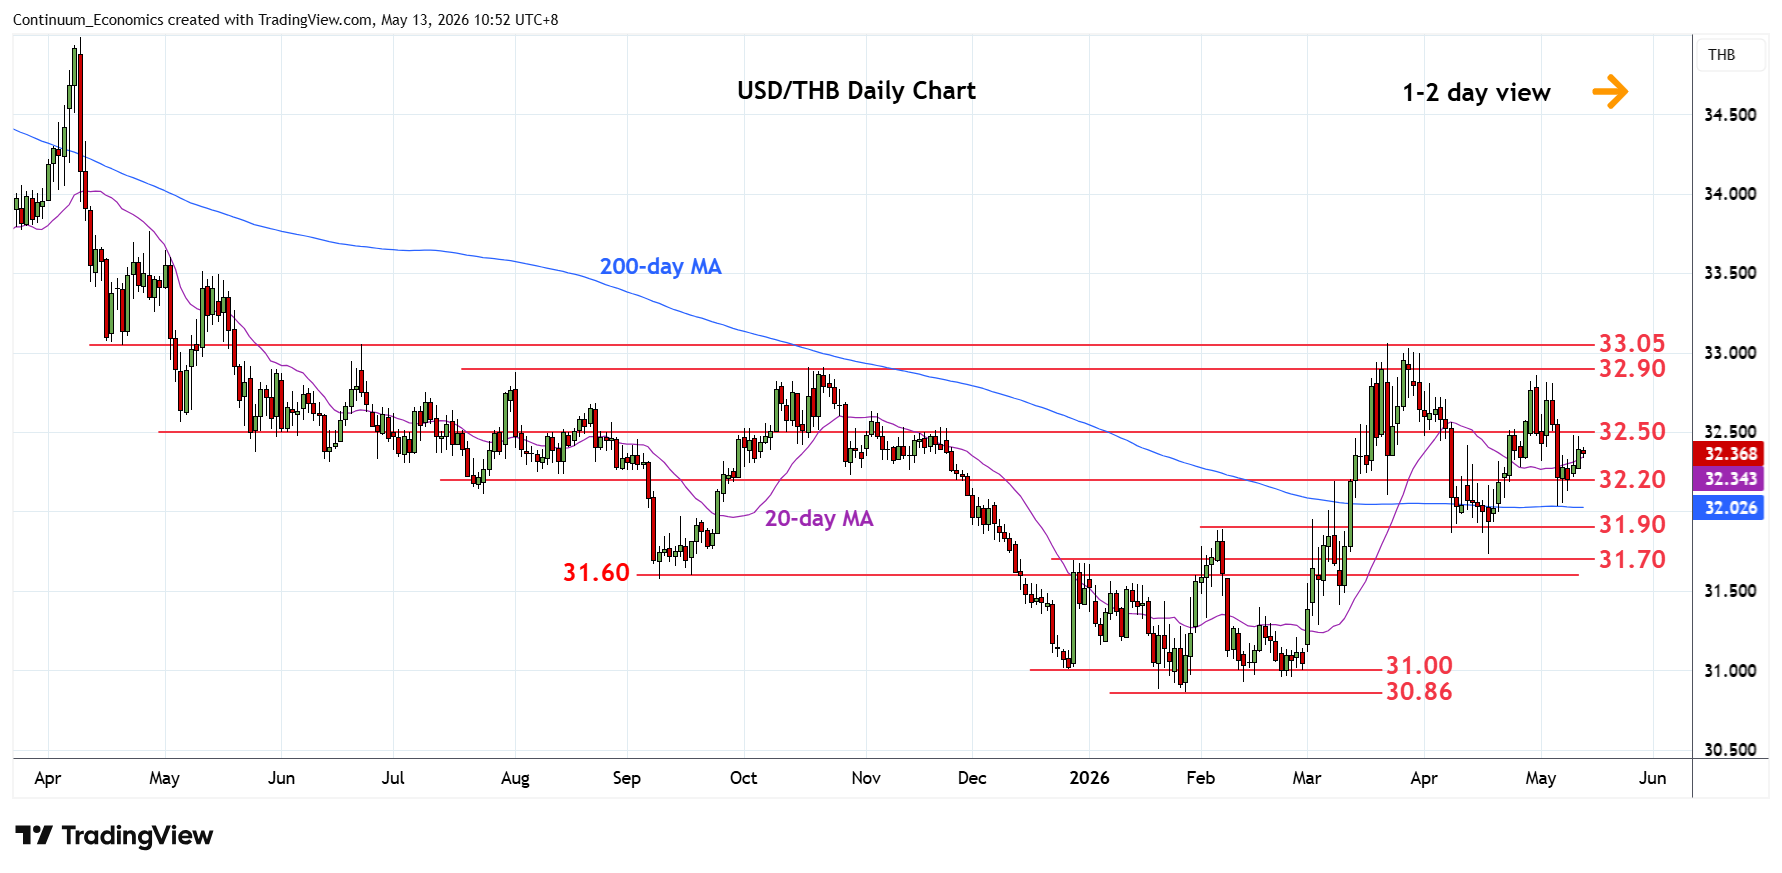
Little change, as prices extend consolidation within the 32.50/32.20 area
| Level | Comment | Level | Comment | |||||
|---|---|---|---|---|---|---|---|---|
| R4 | 32.90 | * | Oct high, congestion | S1 | 32.20 | * | congestion | |
| R3 | 32.80/85 | ** | congestion | S2 | 32.00 | * | congestion | |
| R2 | 32.60 | congestion | S3 | 31.90 | * | Feb high | ||
| R1 | 32.50 | * | congestion | S4 | 31.74 | ** | Apr low |
Asterisk denotes strength of level
02:50 GMT - Little change, as prices extend consolidation within the 32.50/32.20 area following bounce above the 32.00 support. Consolidating is expected to give way to renewed selling pressure later and break of the 32.20 support and 32.00 level will open up room to retest support at 31.90 then the 31.74, April low. Below the latter will see deeper pullback to retrace the January/March rally towards strong support at the 31.70/31.60 area. Meanwhile, resistance remains at the 32.50/60 congestion which is expected to cap and sustain rejection from the 32.80/32.85 highs.