This week's five highlights
Iran Blockade and What Next?
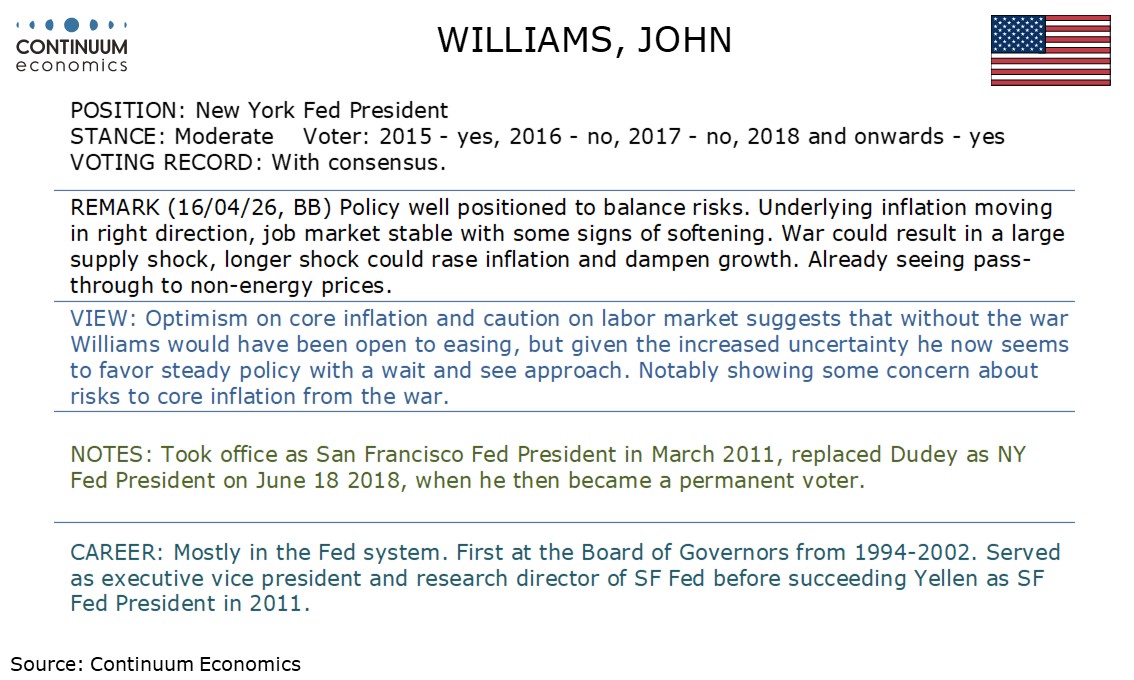
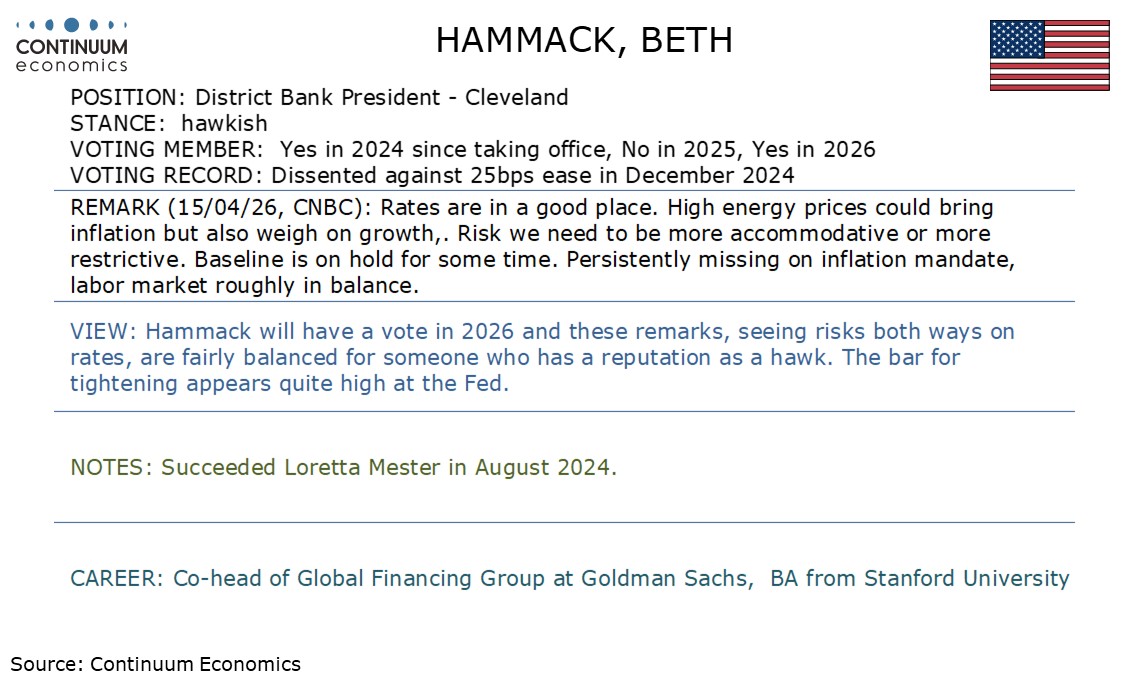
This Week's Fed Speakers
DXY Limited tests higher
UK GDP Fresh But Fleeting Momentum Before the War
China GDP Beat, But Domestic Demand Weak
Figure 1: Iran/Iraq Tanker War 1987-88
| Incident | Comments | |
| USS Stark | May 17 1987 Iraq aircraft attacks USS Stark by mistake | 29 U.S. servicemen killed. Ship has severe list, but avoided sinking and sails to Bahrain. Iraq apologises as they thought it was an Iranian ship. |
| Bridgeton oil tanker | July 24 1987 oil tanker hit by Iran contact mine | Modest damage to huge tanker, but U.S. Navy ships had to follow Bridgeton into Kuwait due to risk of other mines. |
| USS Samuel Roberts | April 18 1988 Iran contact mine hits US frigate | 10 U.S. serviceman injured. Ship keel snapped, but did not sink due to emergency repair work. U.S. launches retaliation attack on Iranian gulf oil platforms 4 days later. |
Source: US Navy/Continuum Economics
Though the U.S. is introducing a blockade on Iran oil exports, we think the U.S. and Iran remain reluctant to restart the war. How Iran responds to the U.S. blockade is important. It could choose to respond by attacking Gulf energy installations before or after the 2-week ceasefire ends on April 22. Alternatively, Iran could seek a path to deescalate, such as not hitting back/extending the ceasefire/a goodwill gesture of allow some shipping through the Straits of Hormuz/setting tolls for all ships to pass through the Straits. This week needs to be watched closely to anticipate the next chapter in the conflict.
Trump administration’s decision to blockade makes sense from a military standpoint, as it achieves the same objective as seizing Kharg Island without boots on the ground – we feel invasion is a very low probability. However, it hurts the GOP and Trump before the mid-terms. It extends the period of military tension, and more importantly keeps gasoline and diesel prices very elevated – the April University of Michigan consumer survey on Friday shows that this is hitting consumer confidence badly. Therefore, we believe the Trump administration could try a 2nd round of negotiations to reach a deal to reopen the Straits of Hormuz. This could also involve extending the 2-week ceasefire. Further talks are feasible but both sides would need to compromise to reach an agreement and the odds remain against a deal. Iran's nuclear ambitions and the volatile status of the Strait of Hormuz remain critical points of contention
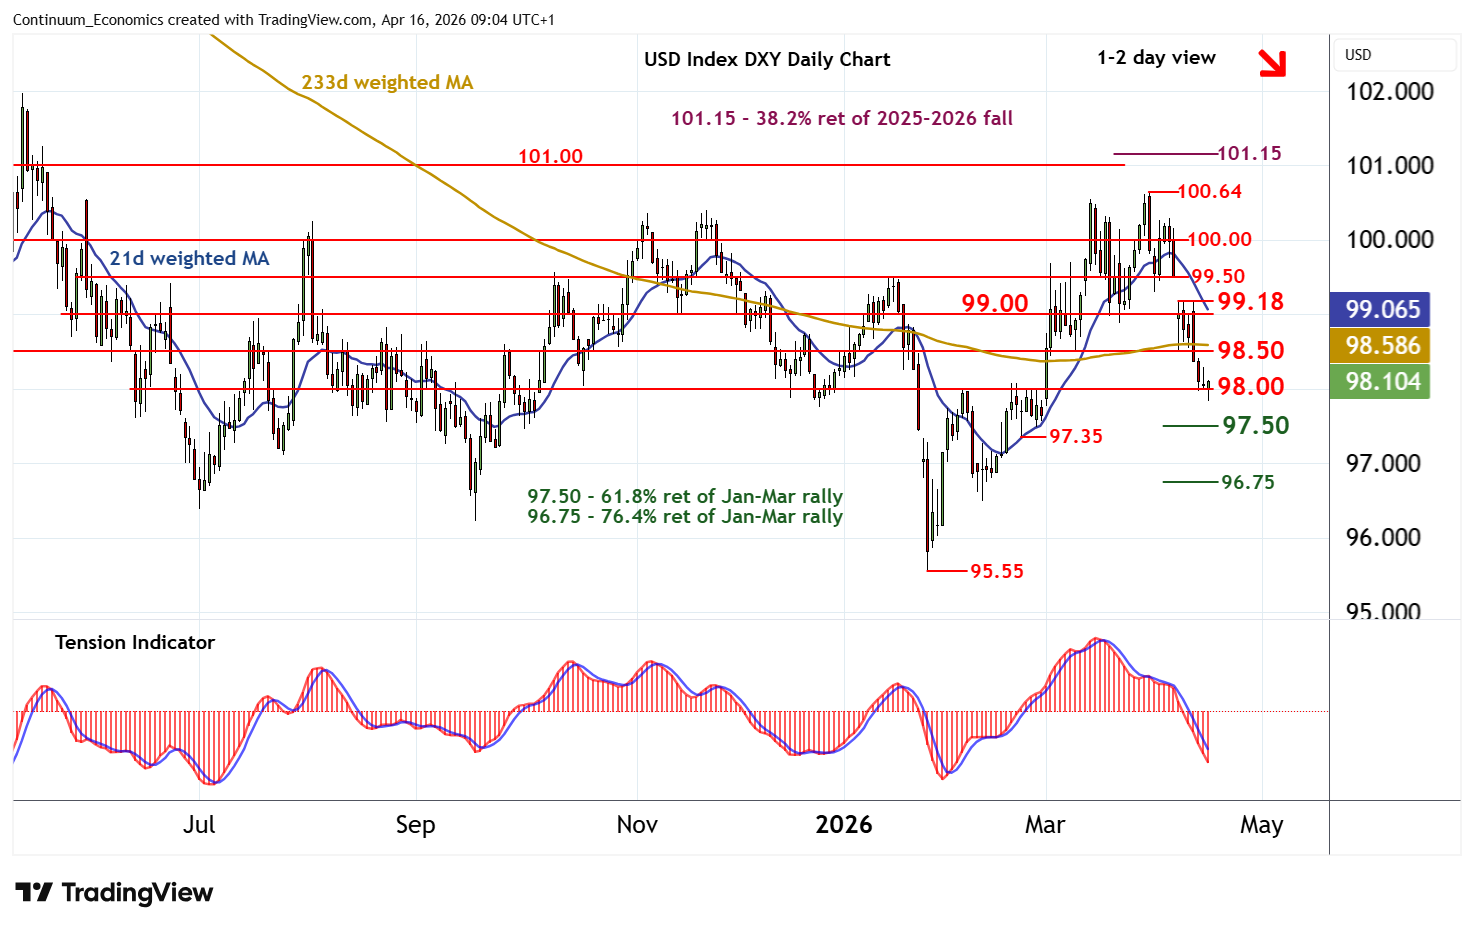
On the chart, consolidation above 98.00 has given way to a test beneath here, with prices reaching 97.83 before bouncing back above 98.00. Rising intraday studies and flat oversold daily stochastics highlight room for a minor bounce. But the negative daily Tension Indicator and bearish weekly charts should limit scope in renewed selling interest beneath congestion resistance at 98.50. Following cautious/corrective trade, fresh losses are looked for. A close below 98.00 will add weight to sentiment and extend late-March losses towards 97.50.
Figure: GDP Growth Hardly Strong and With Increasing Downside Risks Ahead?
Without the outbreak of the Iran War there was already a split within the MPC about the policy outlook and that such divisions may have been accentuated by this latest GDP update which showed a very much above consensus m/m rise of 0.5%, the strongest in 14 months. But of course, the conflict has changed everything (Figure), seemingly shifting the policy debate from the size and speed of further easing to what extent policy needs to be tightened to dampen any second round effects from the current energy prices surge. Notably, Governor Bailey has just suggested the BoE will be in no rush to hike, all the more notable as his comments seem to suggest that he is speaking on behalf of the MPC as a whole or at least a large majority. We very much side with Bailey’s thinking, noting that even with the surprise momentum the UK may have had ahead of the conflict, it is still very modest compared to that seen four years ago when the Ukraine War precipitated the last energy price surge. This is especially so in regard to the consumer with clear implications for inflation risks.
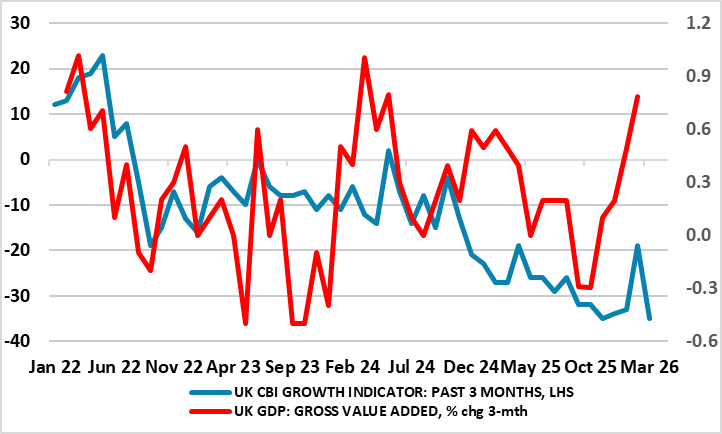
Instead, and as the IMF this week underlined the real economy fall-out the UK may face could be the most sizeable for any major economy. This is very much evident already in business survey data, perhaps best seen in the aggregated numbers produced by the CBI which chime with the GDP data in suggesting some improvement in February but which also suggest that such a pick-up was very short-lived.
Figure: Industrial production and Retail Sales (Yr/Yr %)
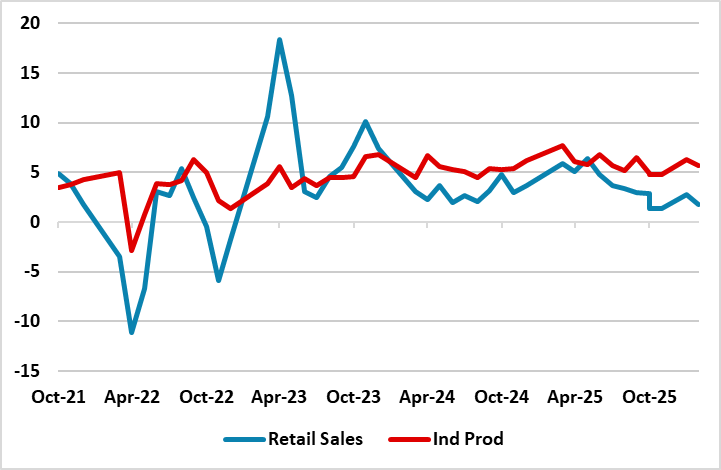
Q1 GDP beat expectations helped by Industrial production, but the domestic demand picture remains weak with soft consumption and the ongoing negative drag from the residential property sector. We still feel that the economy remains too dependent on high tech manufacturing and modest consumption will act as a drag on GDP growth, while the Iran war will have an adverse impact on exports and production from Q2. Additionally, China’s authorities remain reluctant to be aggressive in policy stimulus. We stick with 4.2% GDP growth for 2026.
The Q1 GDP at 5.0% Yr/Yr was better than expected, which was also the case with the March Industrial production data at 5.7% v 5.3% Yr/Yr. The production side of the economy likely accounts for the GDP surprise, as other areas were soft in Q1 except government investment. However, the industrial production buoyance is ahead of domestic demand and we feel that exports are unlikely to fill the gap like 2025. Thus we see industrial production slowing through 2026. One example is automobiles, where production at +7.5% Yr/Yr is way ahead of car sales at -11.8% Yr/Yr.