Chart EUR/CAD Update: Daily studies under pressure
The test below congestion support at 1.6200 has bounced from 1.6175
| Level | Comment | Level | Comment | |||||
|---|---|---|---|---|---|---|---|---|
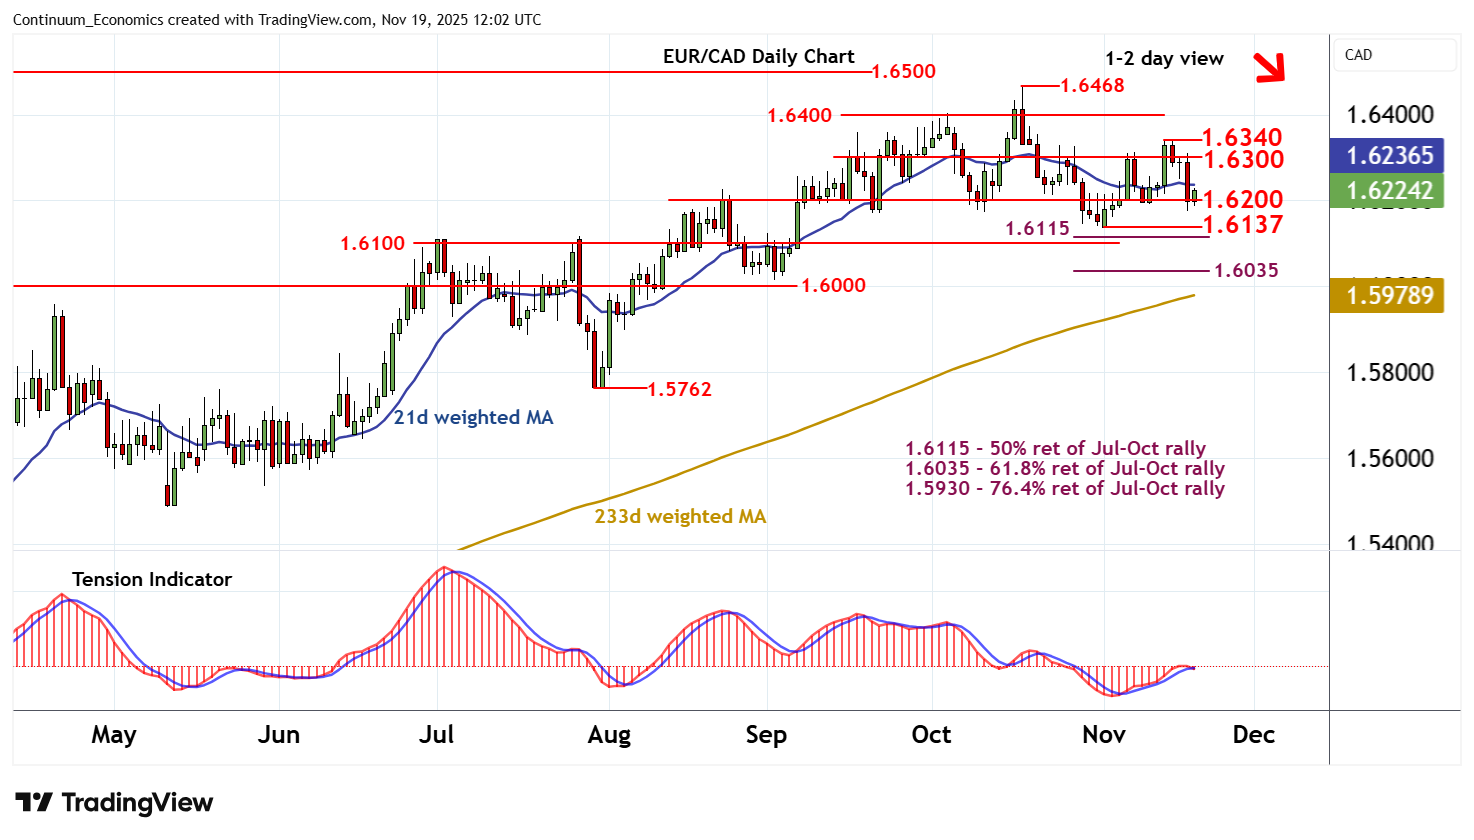
| R4 | 1.6468 | * | 17 Oct YTD high | S1 | 1.6200 | * | congestion | |
| R3 | 1.6400 | * | break level | S2 | 1.6135~ | ** | 3 Nov (w) low | |
| R2 | 1.6340 | * | 13 Nov (w) high | S3 | 1.6115 | ** | 50% ret of Jul-Oct rally | |
| R1 | 1.6300 | * | congestion | S4 | 1.6100 | * | congestion |
Asterisk denotes strength
11:45 GMT - The test below congestion support at 1.6200 has bounced from 1.6175, as intraday studies turn higher, with prices once again trading above 1.6200. However, overbought daily stochastics are unwinding and the daily Tension Indicator is coming under pressure, highlighting room for fresh losses in the coming sessions. A break back below 1.6200 will open up critical support within the 1.6135~ weekly low of 3 November and the 1.6115 Fibonacci retracement. Mixed weekly charts could limit any initial tests in consolidation. Meanwhile, resistance remains at congestion around 1.6300 and extends to the 1.6340 weekly high of 13 November. An unexpected close above here would improve sentiment and extend November gains towards 1.6400, where fresh selling interest is expected to appear.