Published: 2026-03-27T04:43:02.000Z
Chart USD/CNH Update: Higher in consolidation
1
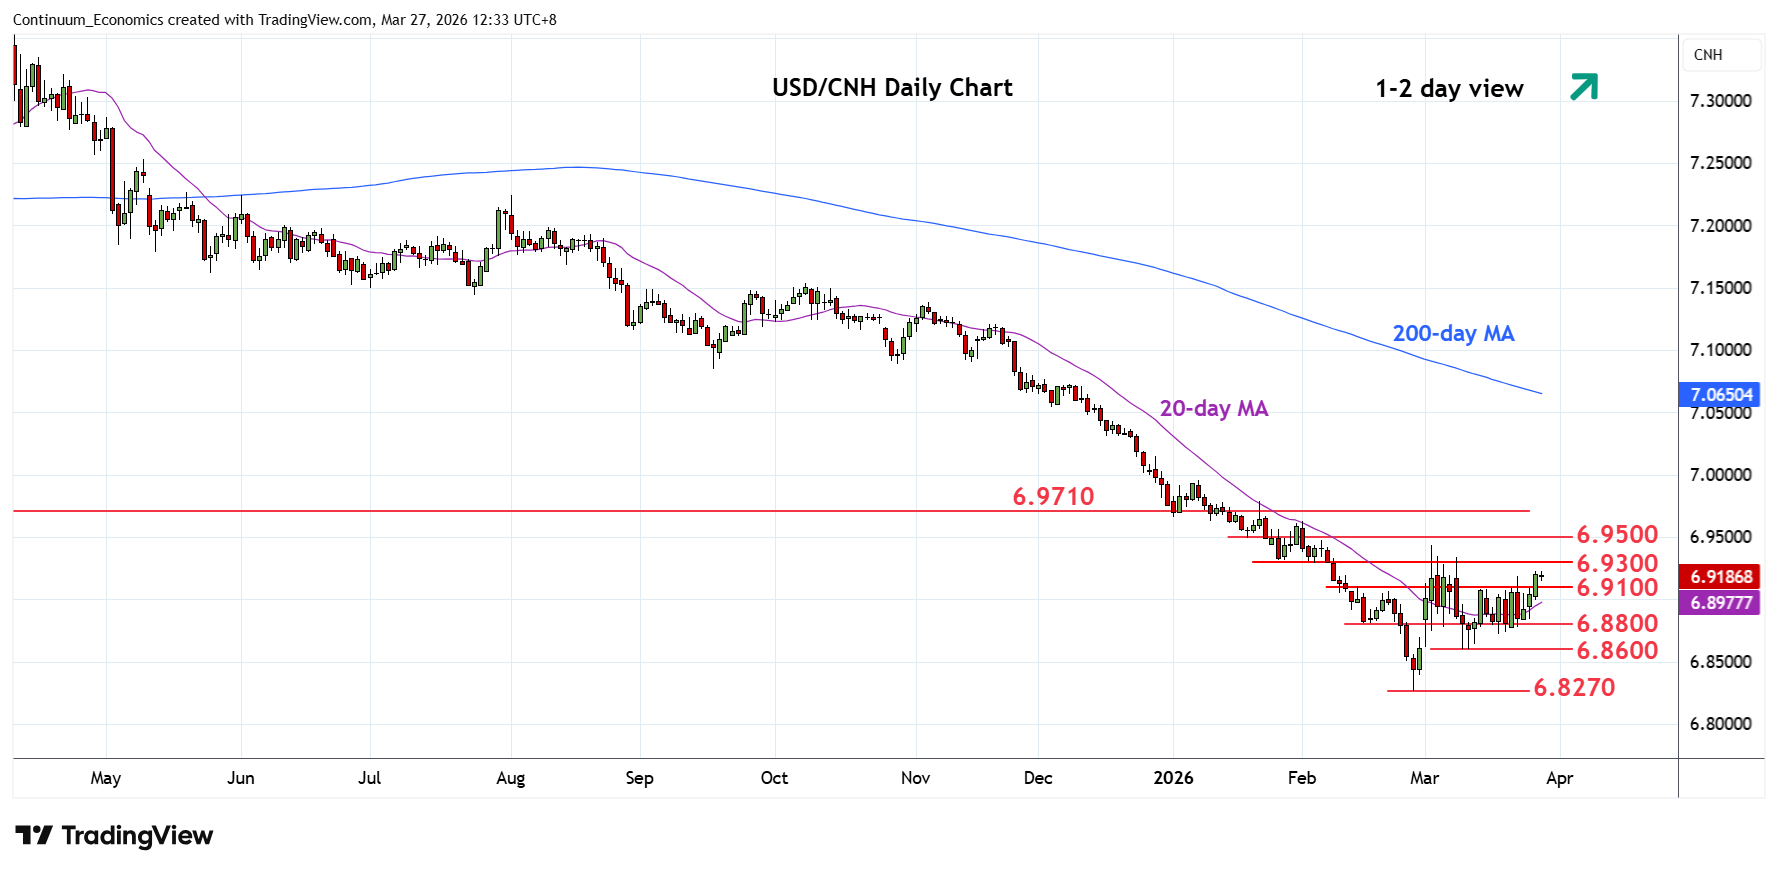
Choppy trade within the 6.9100/6.8800 area has given way to break to extend bounce from the 6.8600 low
| Level | Imp | Comment | Level | Imp | Comment | |||
|---|---|---|---|---|---|---|---|---|
| R4 | 6.9910 | * | 50% Oct/Feb fall | S1 | 6.9100 | * | congestion | |
| R3 | 6.9710 | * | 2024 year low | S2 | 6.8800 | * | 16 Feb low, congestion | |
| R2 | 6.9500 | * | congestion, 38.2% | S3 | 6.8600 | ** | 11 Mar low | |
| R1 | 6.9300 | ** | Jan low, congestion | S4 | 6.8270 | ** | 26 Feb YTD low |
Asterisk denotes strength of level
04:00 GMT - Choppy trade within the 6.9100/6.8800 area has given way to break to extend bounce from the 6.8600 low. Break here opens up room for retest of strong resistance at the 6.9300/6.9500 congestion and 38.2% Fibonacci retracement. Clearance will extend the broader gains from the February current year low and see stronger gains to retrace losses from the October high. Higher will see potential to resistance at 6.9710 and 6.9910, 50% Fibonacci level. Meanwhile, support at the 6.9100/6.9000 congestion area should underpin.