Published: 2026-02-25T02:36:06.000Z
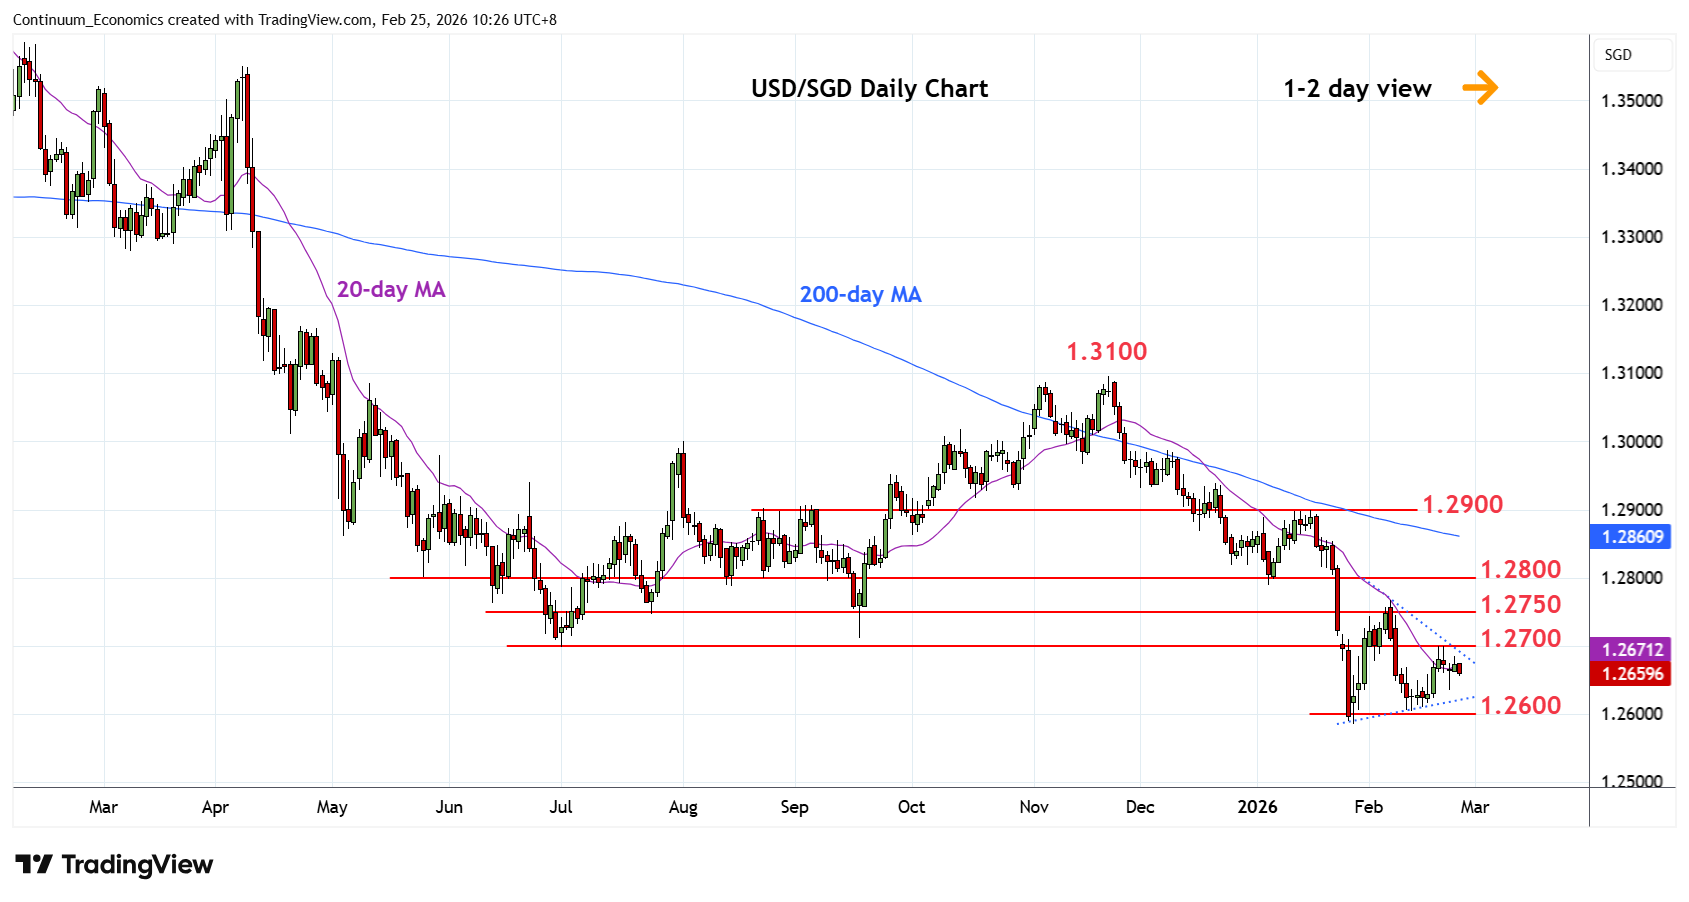
Chart USD/SGD Update: Lower in consolidation below 1.2700
2
Lower in consolidation from test of 1.2700 resistance with mixed daily studies suggesting ranging action likely to extend
| Level | Comment | Level | Comment | ||||
|---|---|---|---|---|---|---|---|
| R4 | 1.2800 | ** | congestion | S1 | 1.2600 | * | congestion |
| R3 | 1.2780 | * | 38.2% Nov/Jan fall | S2 | 1.2586 | ** | 28 Jan YTD low |
| R2 | 1.2768 | ** | 6 Feb high | S3 | 1.2550 | * | congestion |
| R1 | 1.2700 | * | congestion | S4 | 1.2500 | * | congestion |
Asterisk denotes strength of level
02:25 GMT - Lower in consolidation from test of 1.2700 resistance with mixed daily studies suggesting ranging action likely to extend. Would need break here to open up room for retest of the 6 February high at 1.2768. However, consolidation from the January current year low see prices tracing out a triangle pattern and see risk for break of the 1.2600 level and 1.2586 low to extend the November losses from the 1.3100 high. Break will extend the broader losses from the 2020 year high and see extension to the 1.2550/1.2500 congestion area.