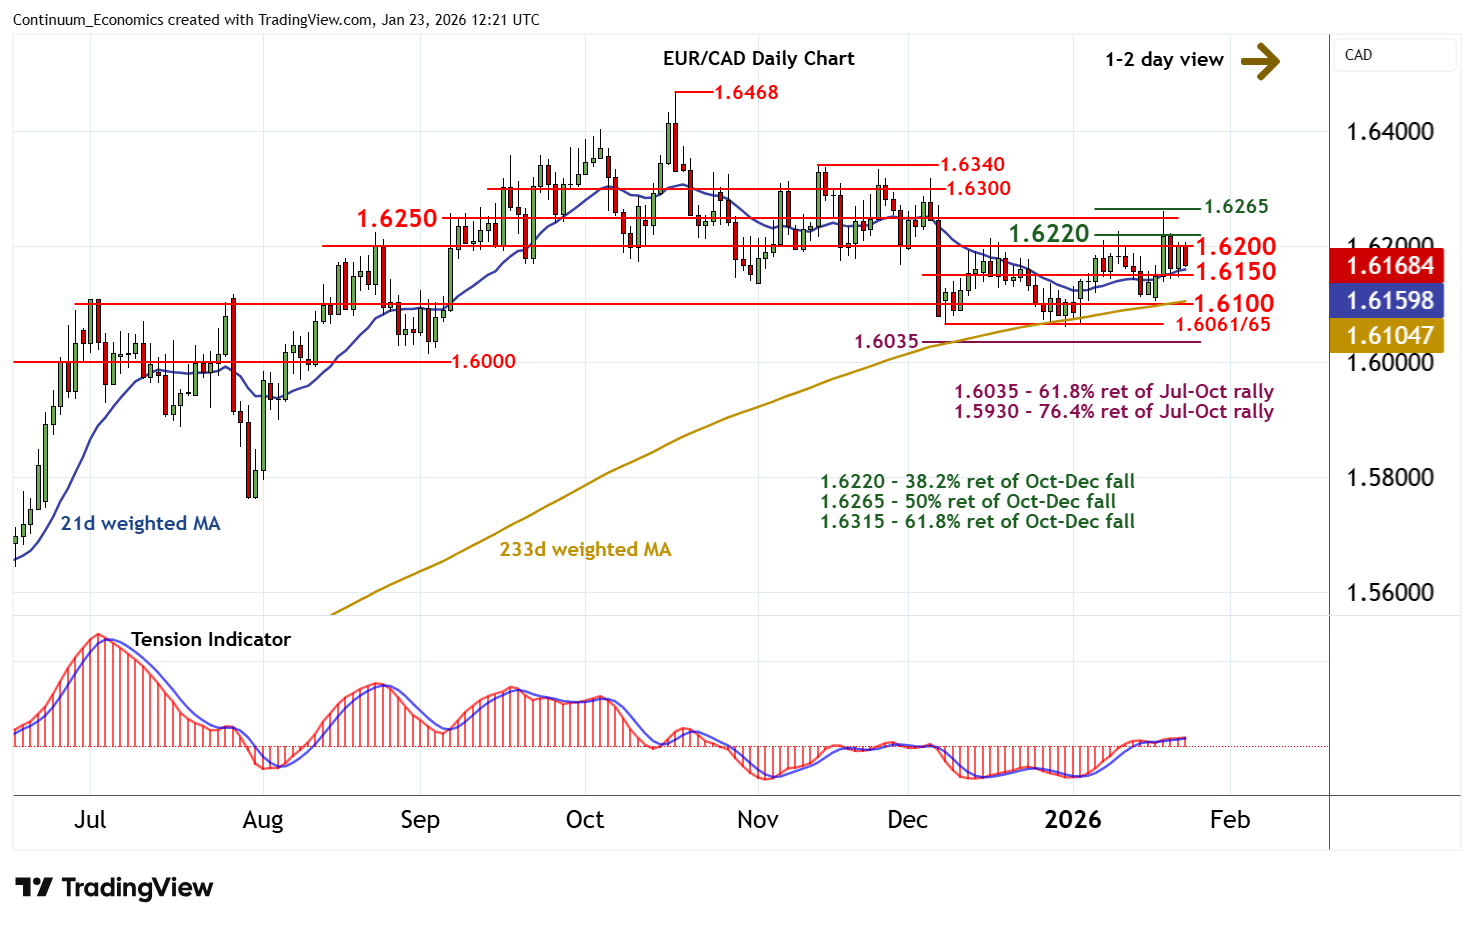
Chart EUR/CAD Update: Choppy trade - background studies improving
The anticipated test of resistance at congestion around 1.6200 and the 1.6220 Fibonacci retracement has been pushed back
| Level | Comment | Level | Comment | |||||
|---|---|---|---|---|---|---|---|---|
| R4 | 1.6265 | * | 50% ret of Oct-Dec fall | S1 | 1.6150 | * | congestion | |
| R3 | 1.6250 | break level | S2 | 1.6100 | * | congestion | ||
| R2 | 1.6220 | * | 38.2% ret of Oct-Dec fall | S3 | 1.6061/65 | * | 8-31 Dec (m) lows | |
| R1 | 1.6200 | * | congestion | S4 | 1.6035 | ** | 61.8% ret of Jul-Oct rally |
Asterisk denotes strength
11:35 GMT - The anticipated test of resistance at congestion around 1.6200 and the 1.6220 Fibonacci retracement has been pushed back, as intraday studies turn down, with prices currently trading around 1.6170. Daily readings are under pressure, highlighting room for a test of congestion support at 1.6150. But rising weekly charts should limit any break in renewed buying interest above further congestion around 1.6100. Following cautious trade, fresh gains are looked for. A break above 1.6220 will open up 1.6250/65. However, negative longer-term charts are expected to limit any tests in profit-taking/consolidation.