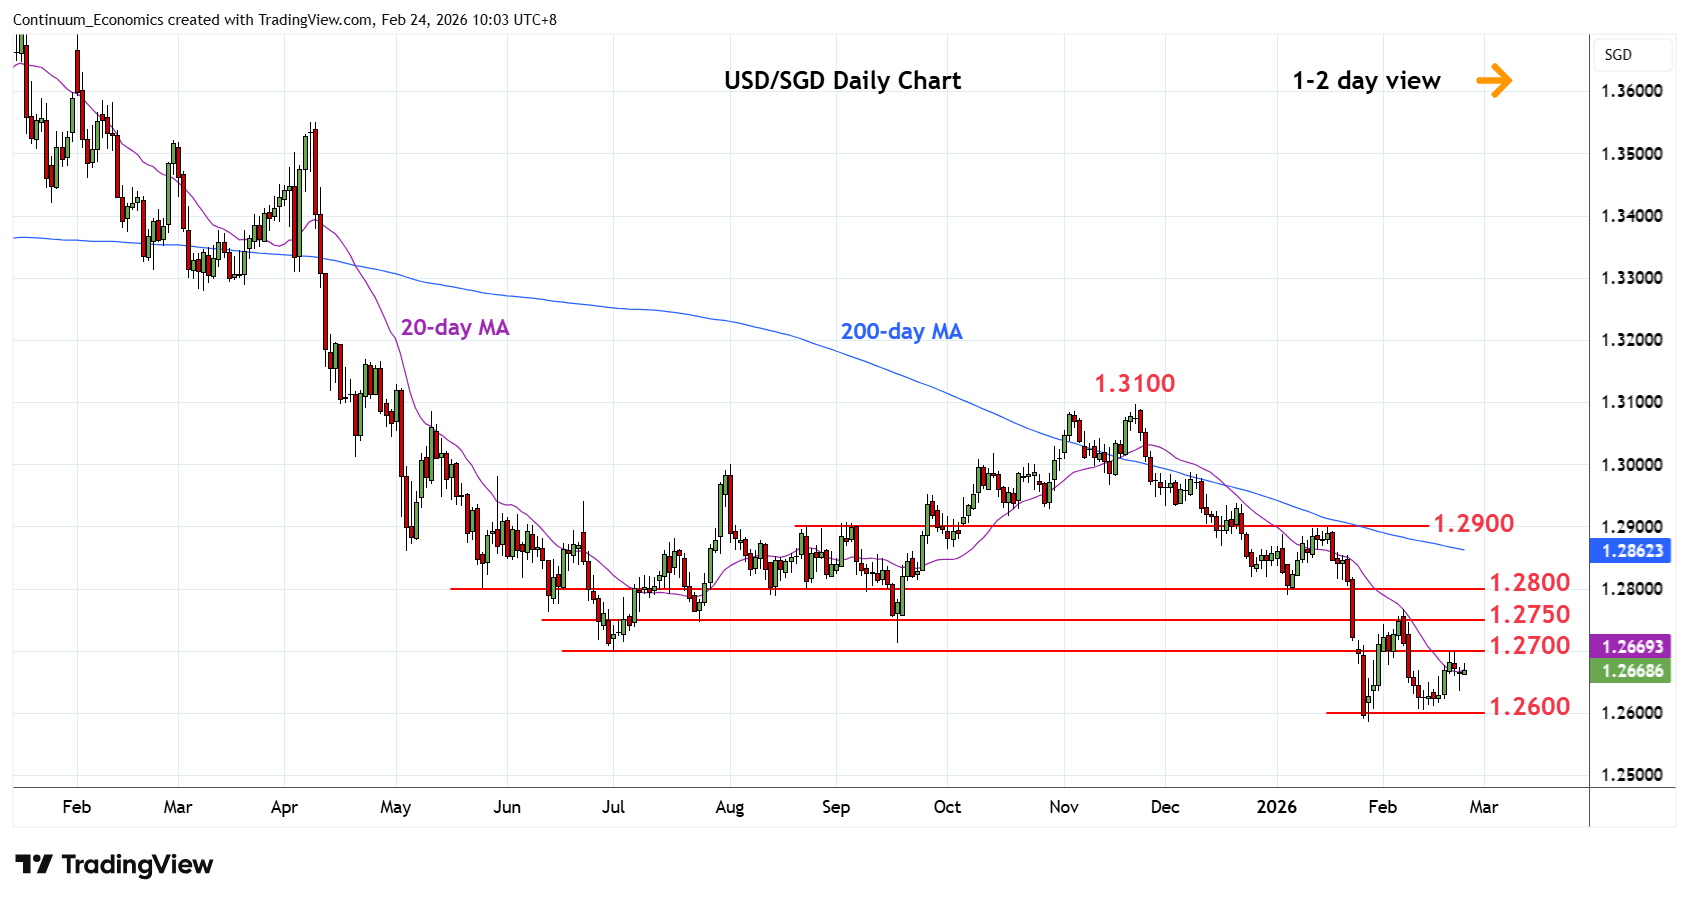
Chart USD/SGD Update: Consolidating test of 1.2700 resistance
Settled back in consolidation from test of 1.2700 resistance but positive daily studies suggest scope to further pressure the upside
| Level | Comment | Level | Comment | ||||
|---|---|---|---|---|---|---|---|
| R4 | 1.2800 | ** | congestion | S1 | 1.2600 | * | congestion |
| R3 | 1.2780 | * | 38.2% Nov/Jan fall | S2 | 1.2586 | ** | 28 Jan YTD low |
| R2 | 1.2768 | ** | 6 Feb high | S3 | 1.2550 | * | congestion |
| R1 | 1.2700 | * | congestion | S4 | 1.2500 | * | congestion |
Asterisk denotes strength of level
02:25 GMT - Settled back in consolidation from test of 1.2700 resistance but positive daily studies suggest scope to further pressure the upside. Above here will open up room for retest of the 6 February high at 1.2768. Clearance will see room for stronger corrective gains to retrace losses from the 1.3100 November high to the 1.2780/00, 38.2% Fibonacci level and congestion area. Meanwhile, support at the 1.2600/1.2586 congestion and January current year low underpin. A later break here will extend the broader losses from the 2020 year high and see extension to the 1.2550/1.2500 congestion area.