Published: 2026-01-12T06:56:18.000Z
Chart USD/TWD Update: Extending gains
-
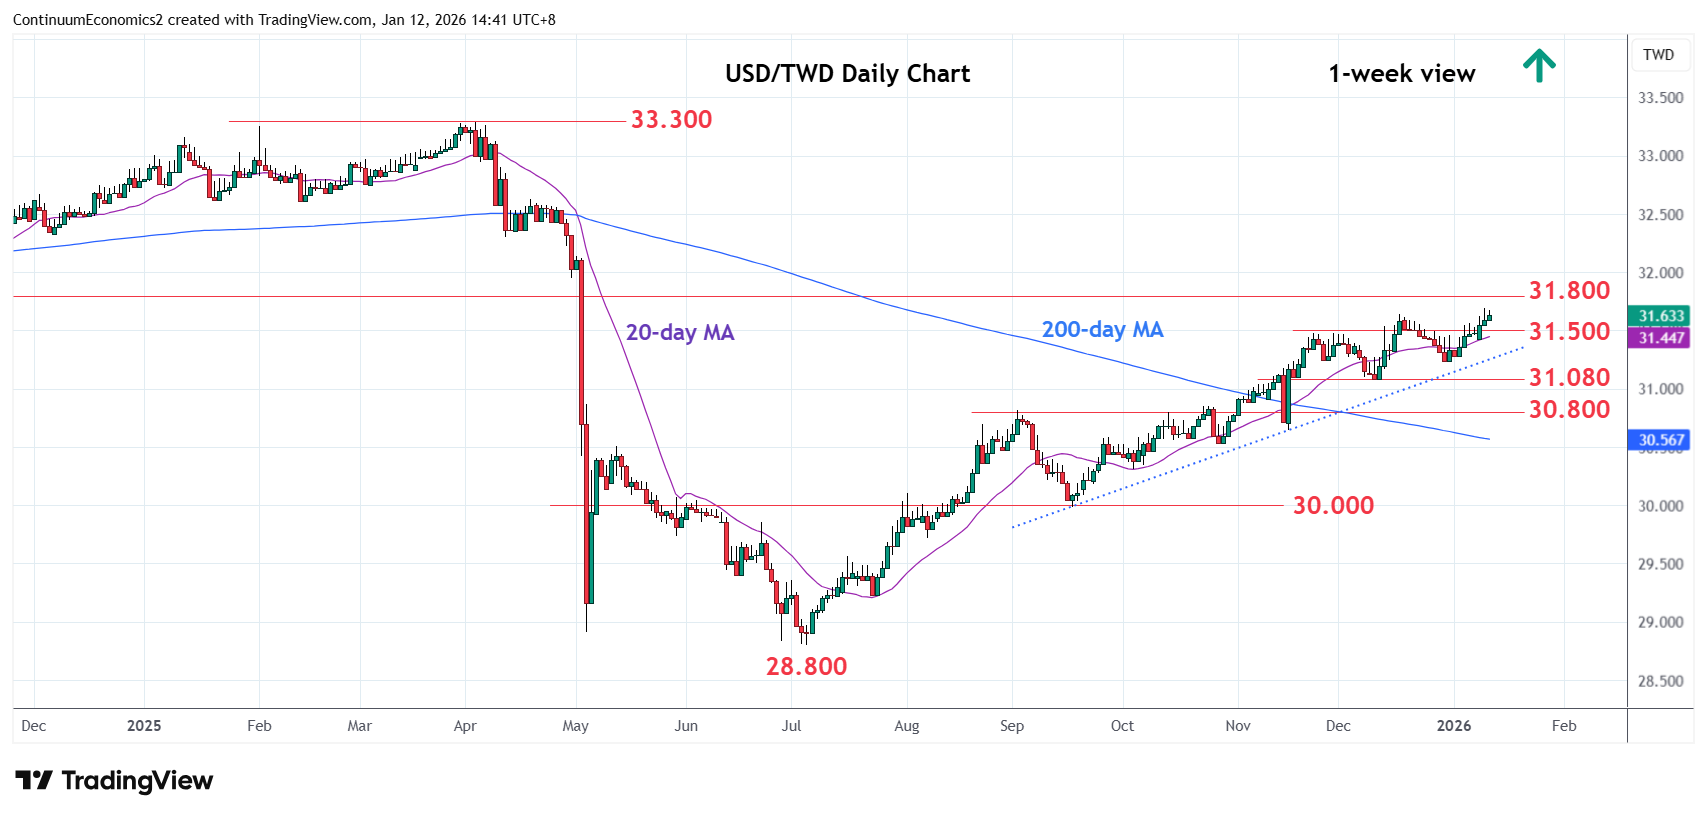
Break above the 31.500 congestion and 31.640, December high, see prices extending the July gains to reach 31.690 high
| Levels | Imp | Comment | Levels | Imp | Comment | |||
|---|---|---|---|---|---|---|---|---|
| R4 | 32.300 | * | 11 Apr low | S1 | 31.500 | * | Nov high, congestion | |
| R3 | 32.240 | * | 76.4% Apr/Jul fall | S2 | 31.240 | * | 30 Dec low | |
| R2 | 32.000 | ** | figure, congestion | S3 | 31.080/00 | ** | 10 Dec low, congestion | |
| R1 | 31.800 | * | congestion | S4 | 30.800 | * | congestion |
06:50 GMT - Break above the 31.500 congestion and 31.640, December high, see prices extending the July gains to reach 31.690 high. Higher still, will see room to target the 31.800 congestion from the November 2024 low and 32.000 figure. However, deep overbought daily and weekly studies caution corrective pullback to retrace strong gains from the 28.800, July low. Meanwhile, support is raised to the 31.500 congestion which should underpin. Would take break here to delay bulls and see room for deeper corrective pullback strong support at the 31.240/31.080 area.