Published: 2026-04-01T02:19:23.000Z
Chart USD/SGD Update: Outside range weighs
1
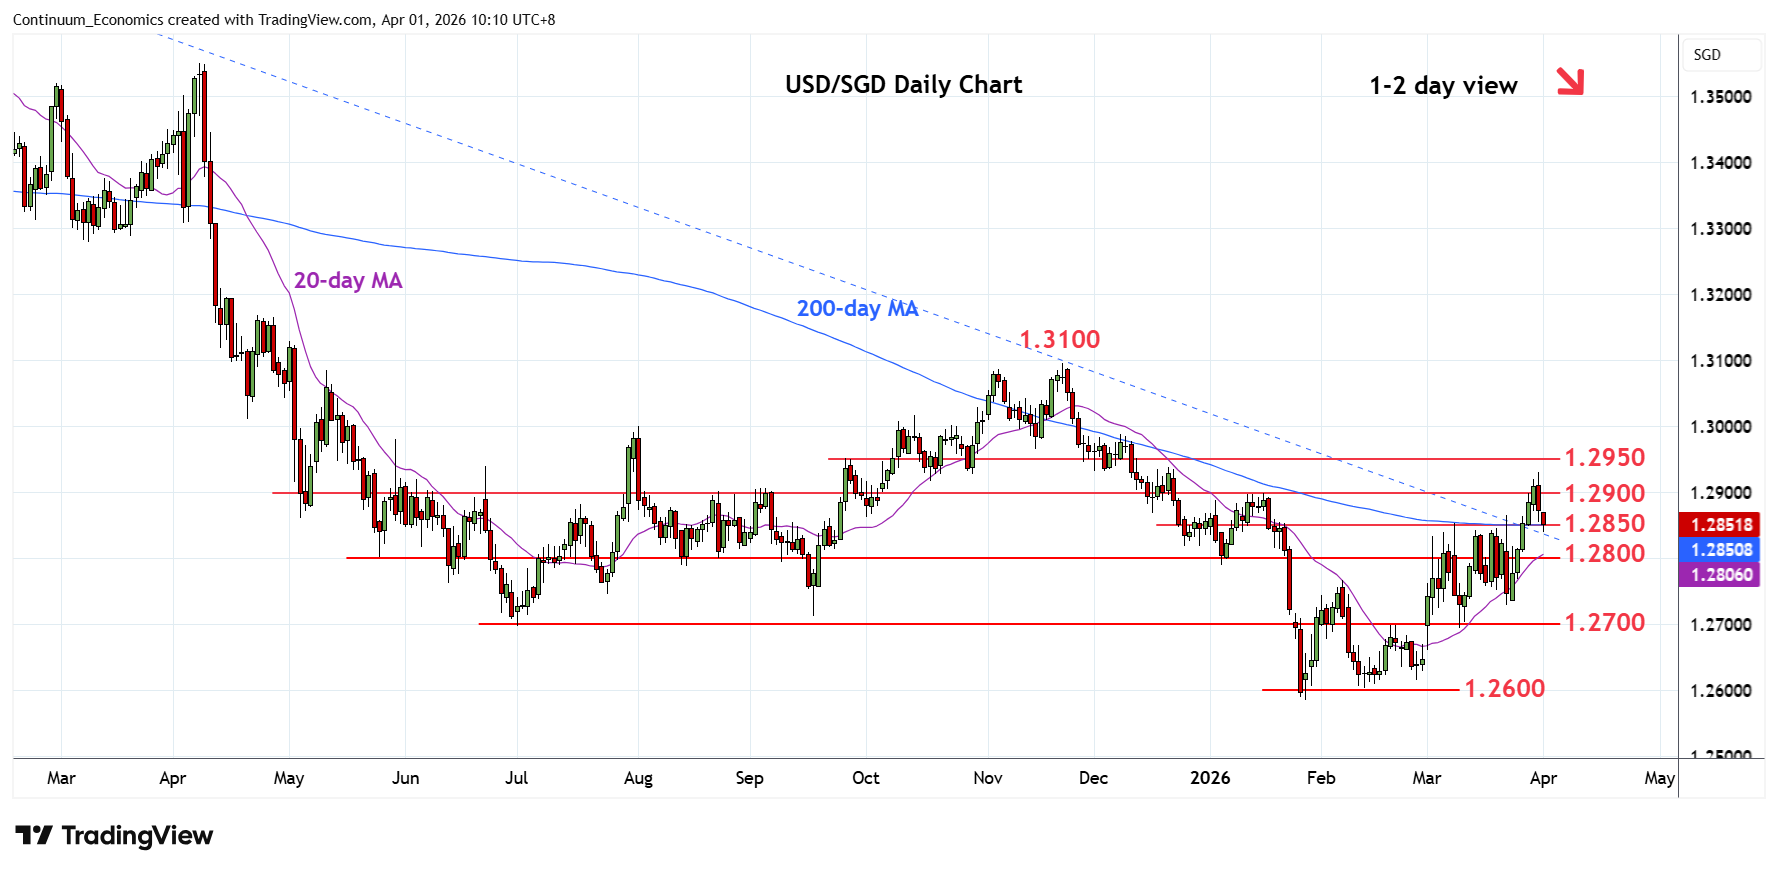
Turned down from fresh year high at 1.2930 as prices unwind overbought intraday studies
| Level | Comment | Level | Comment | ||||
|---|---|---|---|---|---|---|---|
| R4 | 1.2975 | * | 76.4% Nov/Jan fall | S1 | 1.2850 | * | congestion |
| R3 | 1.2950 | * | congestion | S2 | 1.2800 | * | congestion |
| R2 | 1.2930 | ** | 31 Mar YTD high | S3 | 1.2730 | ** | 23 Mar low |
| R1 | 1.2900 | * | congestion | S4 | 1.2700 | ** | 19 Feb high, 2025 yr low |
Asterisk denotes strength of level
02:10 GMT - Turned down from fresh year high at 1.2930 as prices unwind overbought intraday studies. The resulting outside range suggest prices now reversing recent gains from the 1.2930 low of last week. Daily studies are overbought and suggest scope for break of support at the 1.2850/1.2800 congestion to open up room for deeper pullback to strong support at the 1.2768/30 area and 1.2700 level. Meanwhile, resistance is at 1.2900/30 area is expected to cap. Clearance, if seen, will further retrace losses from the November high and see room to 1.2976, 76.4% Fibonacci retracement.