Published: 2026-02-03T05:51:52.000Z
Chart USD/IDR Updates: Consolidating retest of 16770/16800 resistance
1
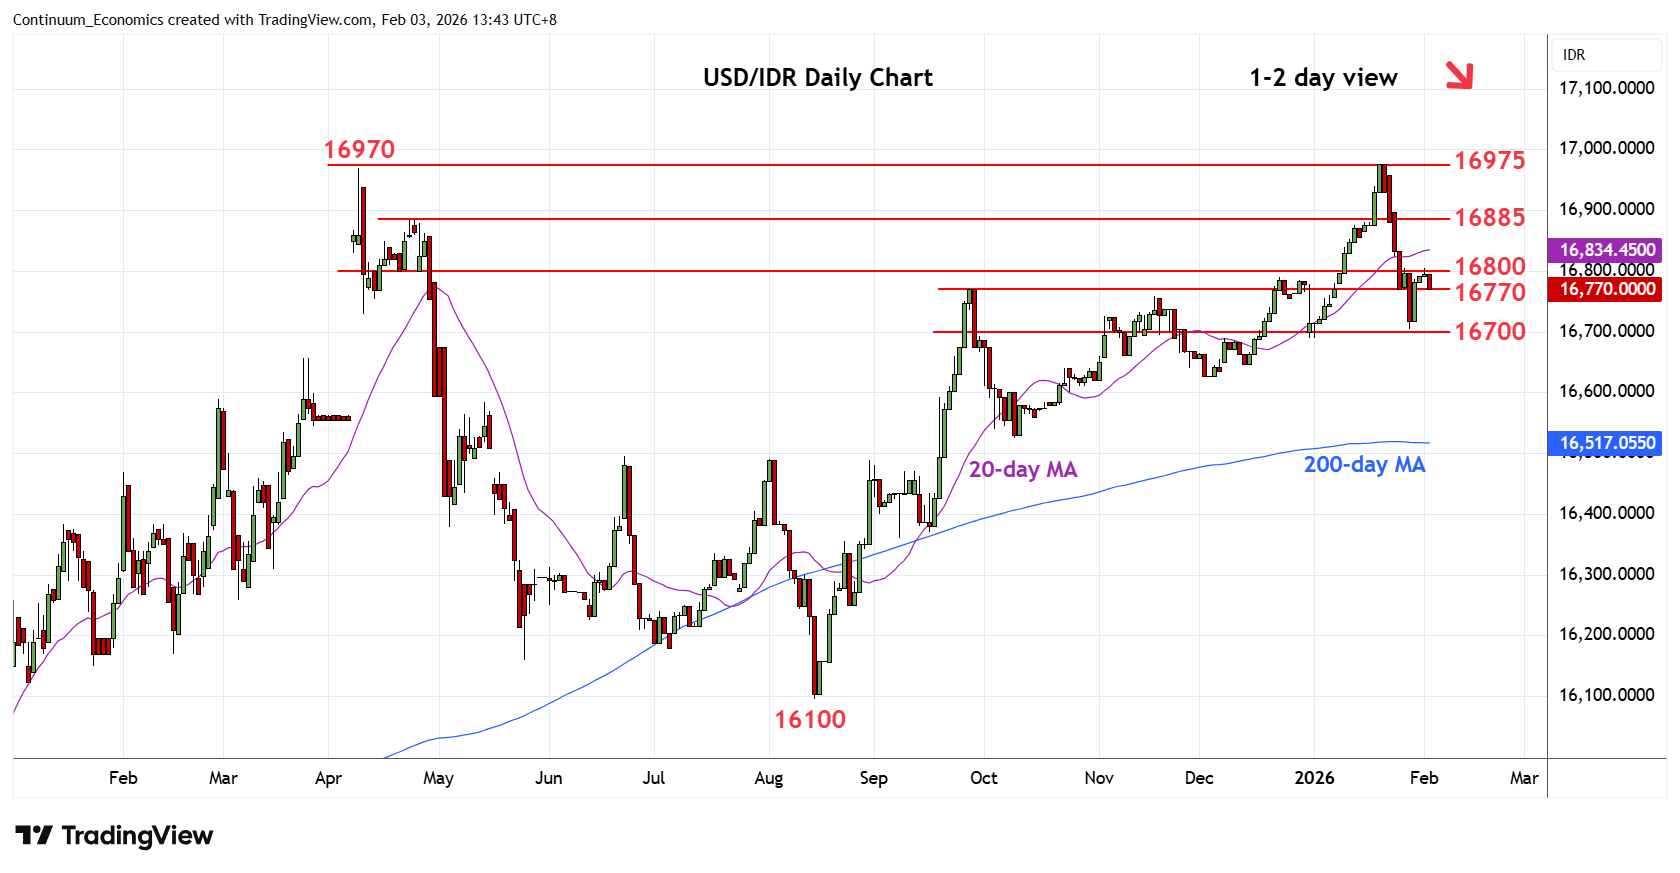
Bounce from the 16705 low see prices back to retest strong resistance at the 16770/16800
| Levels | Imp | Comment | Levels | Imp | Comment | |||
|---|---|---|---|---|---|---|---|---|
| R4 | 17050 | * | projection | S1 | 16705 | ** | Jan low | |
| R3 | 16975 | ** | 20 Jan all-time high | S2 | 16690 | * | 31 Dec low | |
| R2 | 16885 | * | 23 Apr high | S3 | 16640 | * | 38.2% Aug/Jan rally | |
| R1 | 16800 | ** | congestion | S4 | 16600 | * | congestion |
Asterisk denotes strength of level
05:45 GMT - Bounce from the 16705 low see prices back to retest strong resistance at the 16770/16800 September high and congestion area. While this area caps scope is seen for pullback to retest the 16705 low and 16990 support. Break of the latter will open up room for deeper pullback to retrace the August/January gains and see extension to the 16640, 38.2% Fibonacci level, and the strong support at 16625/16600 area. Would take break above 16800 to open up room for extension to retest 16885 resistance.