Published: 2026-04-10T04:28:36.000Z
Chart USD/IDR Updates: Extending gains
3
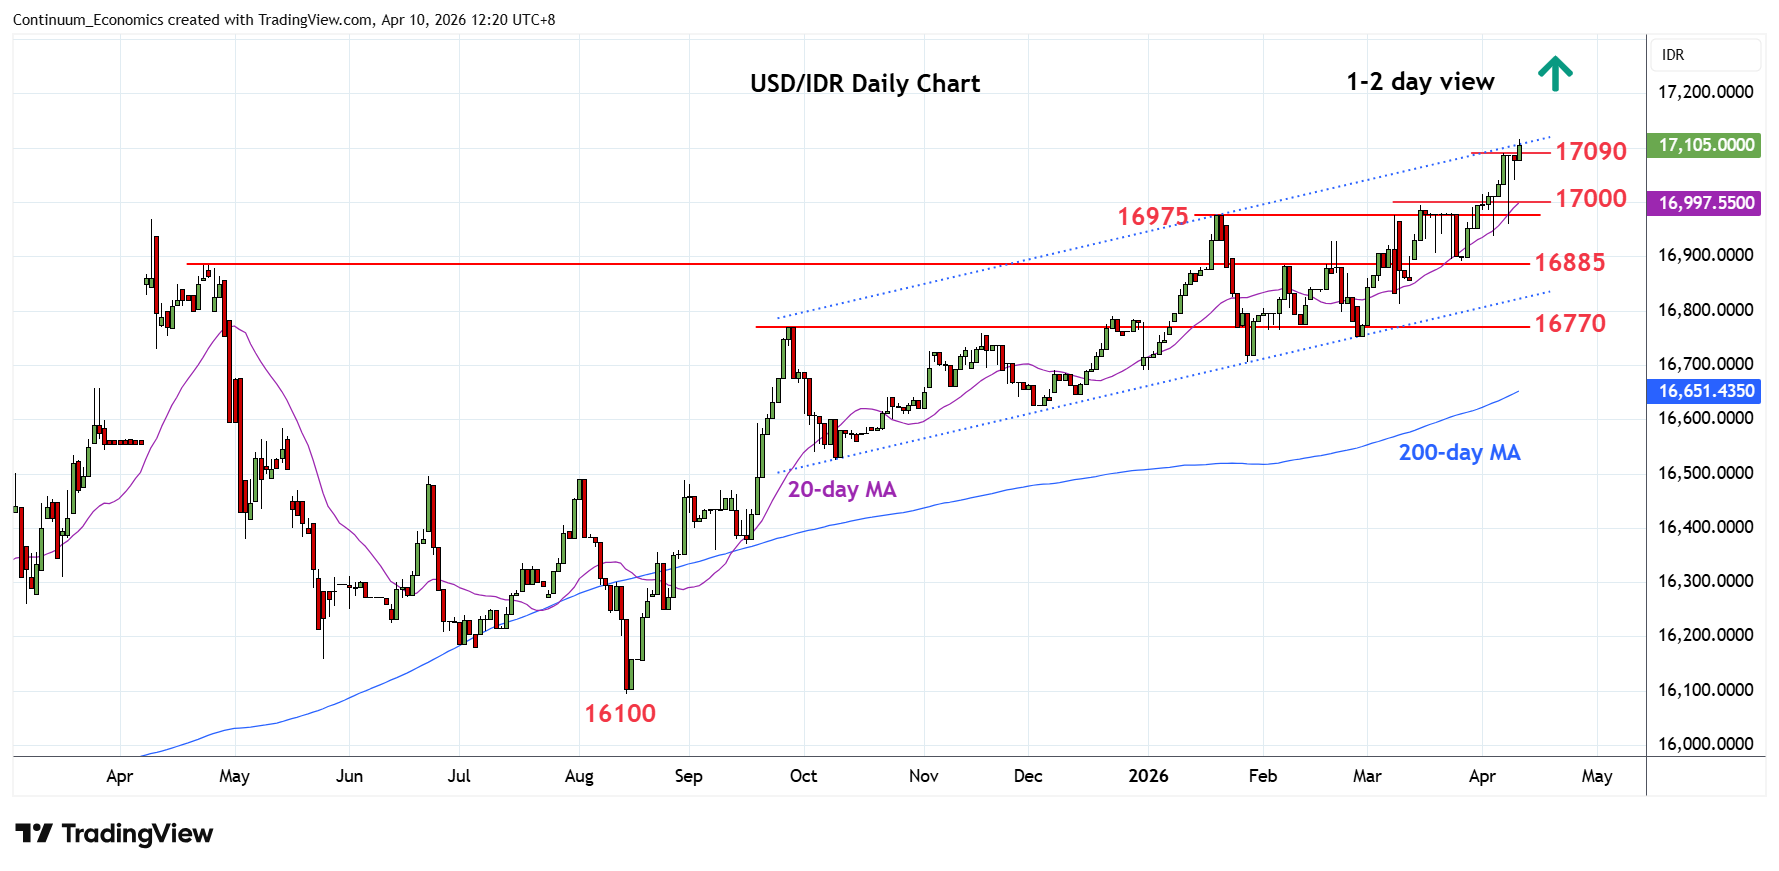
Consolidation below the 17090 high has given way to break to extend the underlying bull trend
| Levels | Imp | Comment | Levels | Imp | Comment | |||
|---|---|---|---|---|---|---|---|---|
| R4 | 18000 | figure | S1 | 16995/75 | ** | Mar/Jan highs | ||
| R3 | 17600 | projection | S2 | 16885 | ** | congestion | ||
| R2 | 17200 | projection | S3 | 16800 | * | congestion | ||
| R1 | 17115 | intraday high | S4 | 16755 | ** | Feb low |
Asterisk denotes strength of level
04:20 GMT - Consolidation below the 17090 high has given way to break to extend the underlying bull trend to reach fresh intraday high at 17115. Nearby see room to target the 17200/400 projection area but overbought daily and weekly studies caution corrective pullback. Meanwhille, the recent March and January highs at 16995/16975 now turned support should underpin. Would take break here to fade the upside pressure and see room for deeper corrective pullback to strong support at the 16900/16885 congestion area.