Chartbook: Chart USD Index DXY: Lower in range - studies under pressure

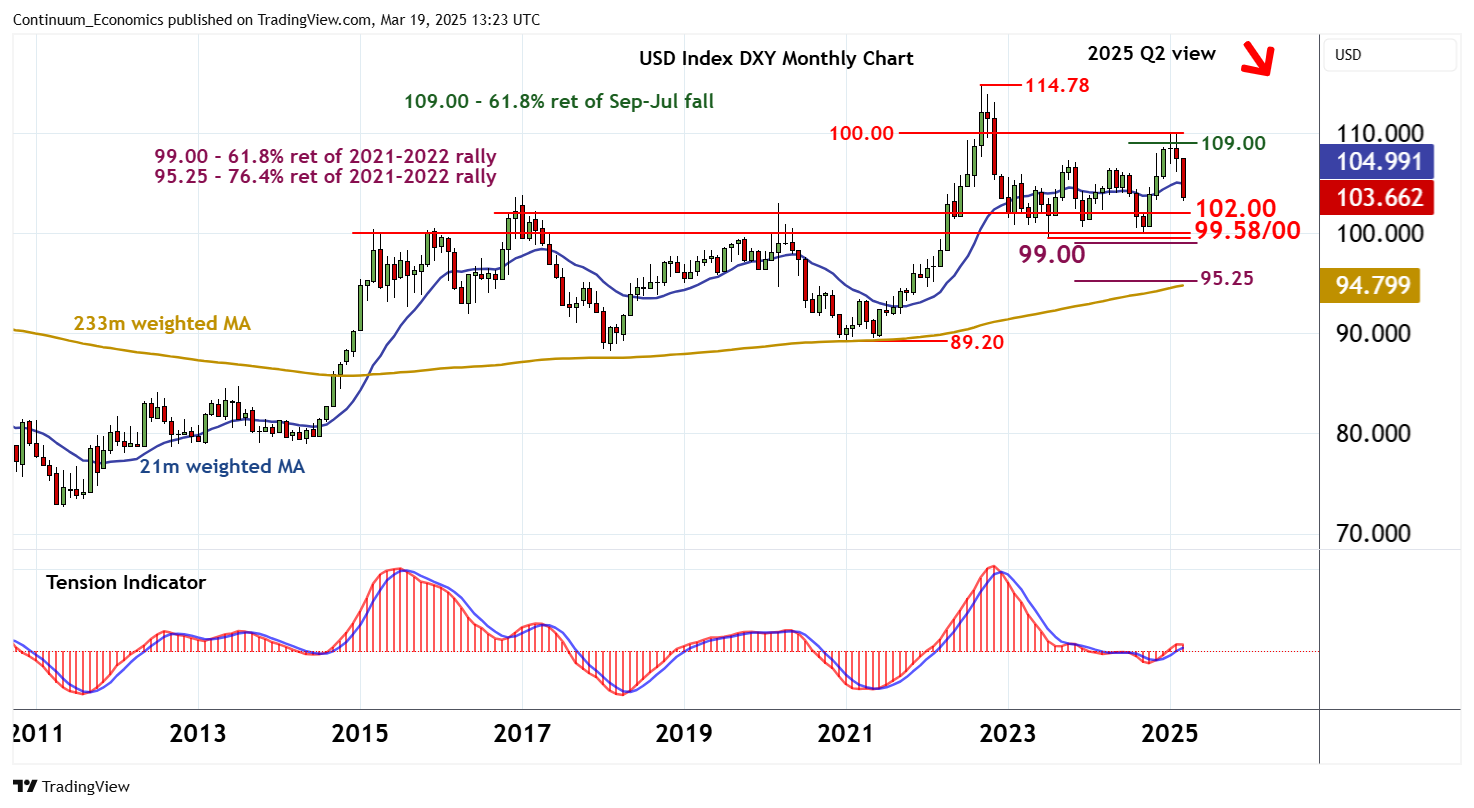
The anticipated break higher has reached strong resistance at the 109.00 Fibonacci retracement and psychological resistance at 110.00
The anticipated break higher has reached strong resistance at the 109.00 Fibonacci retracement and psychological resistance at 110.00,

where selling interest has appeared, pushing prices sharply lower to currently trade around 103.65.
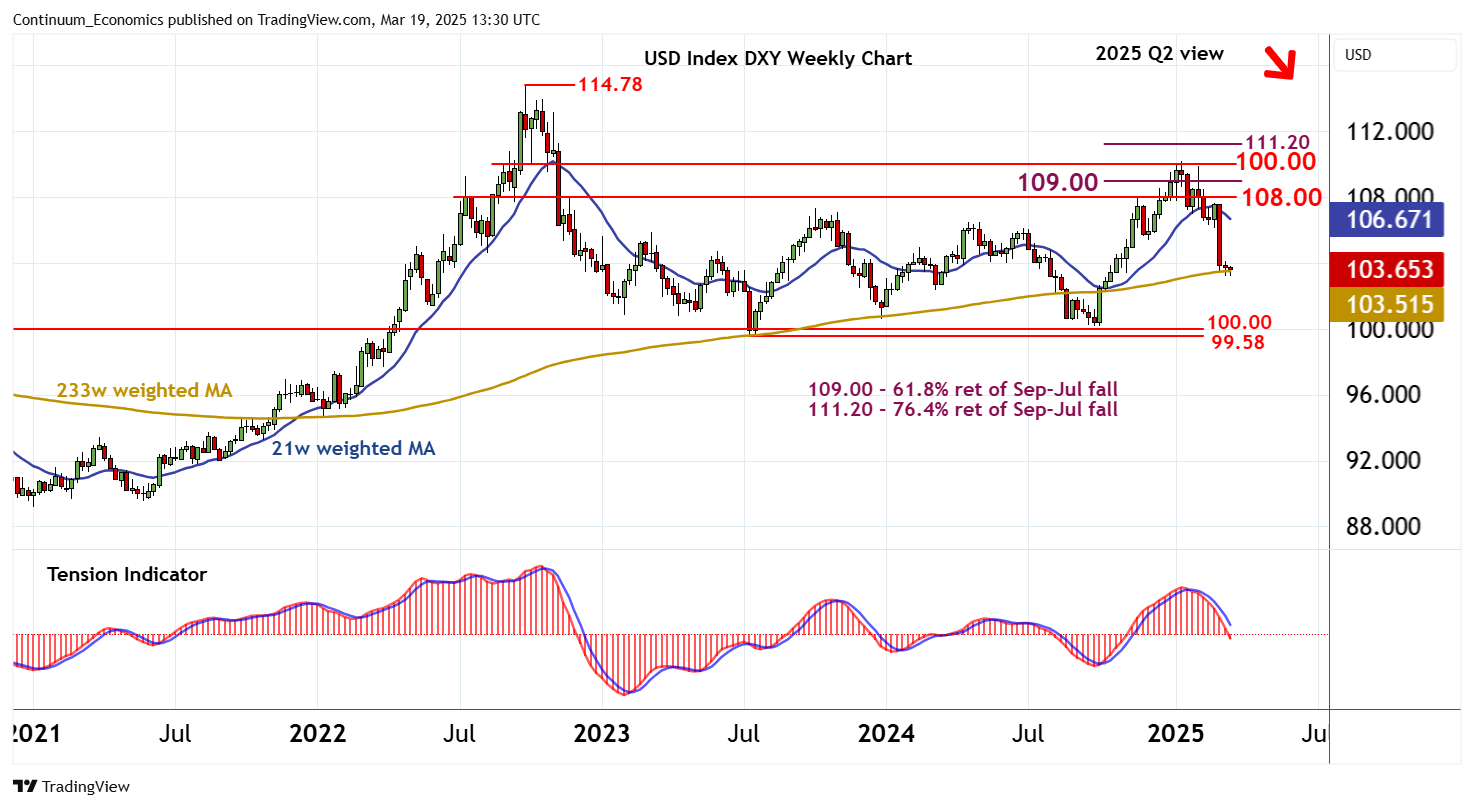
Overbought monthly stochastics are unwinding and the positive monthly Tension Indicator is also coming under pressure, highlighting potential for further losses in the coming weeks. Focus is on congestion support at 102.00, with a break beneath here opening up critical support at the 99.58 year low of July 2023 and congestion around 100.00.
Just lower is the 99.00 Fibonacci retracement.
Already oversold weekly studies could limit any initial tests of this broad range in fresh consolidation, before prices extend lower.
A close beneath here will complete the multi-month distribution pattern and confirm a significant top in place at the 114.78 year high of September 2022. Focus will then turn to the 95.25 Fibonacci retracement, with potential for still deeper losses as longer-term charts also turn down.
Meanwhile, immediate resistance is at congestion around 108.00.

A close above here, if seen, would help to stabilise price action and prompt fresh consolidation within the 109.00 - 110.00 range.
However, a further close above here is needed, not seen, to turn sentiment positive and confirm continuation of gains from 99.58, initially targeting the 111.20 retracement.