Published: 2026-04-30T05:28:49.000Z
Chart USD/IDR Updates: Extending gains to fresh historic high
2
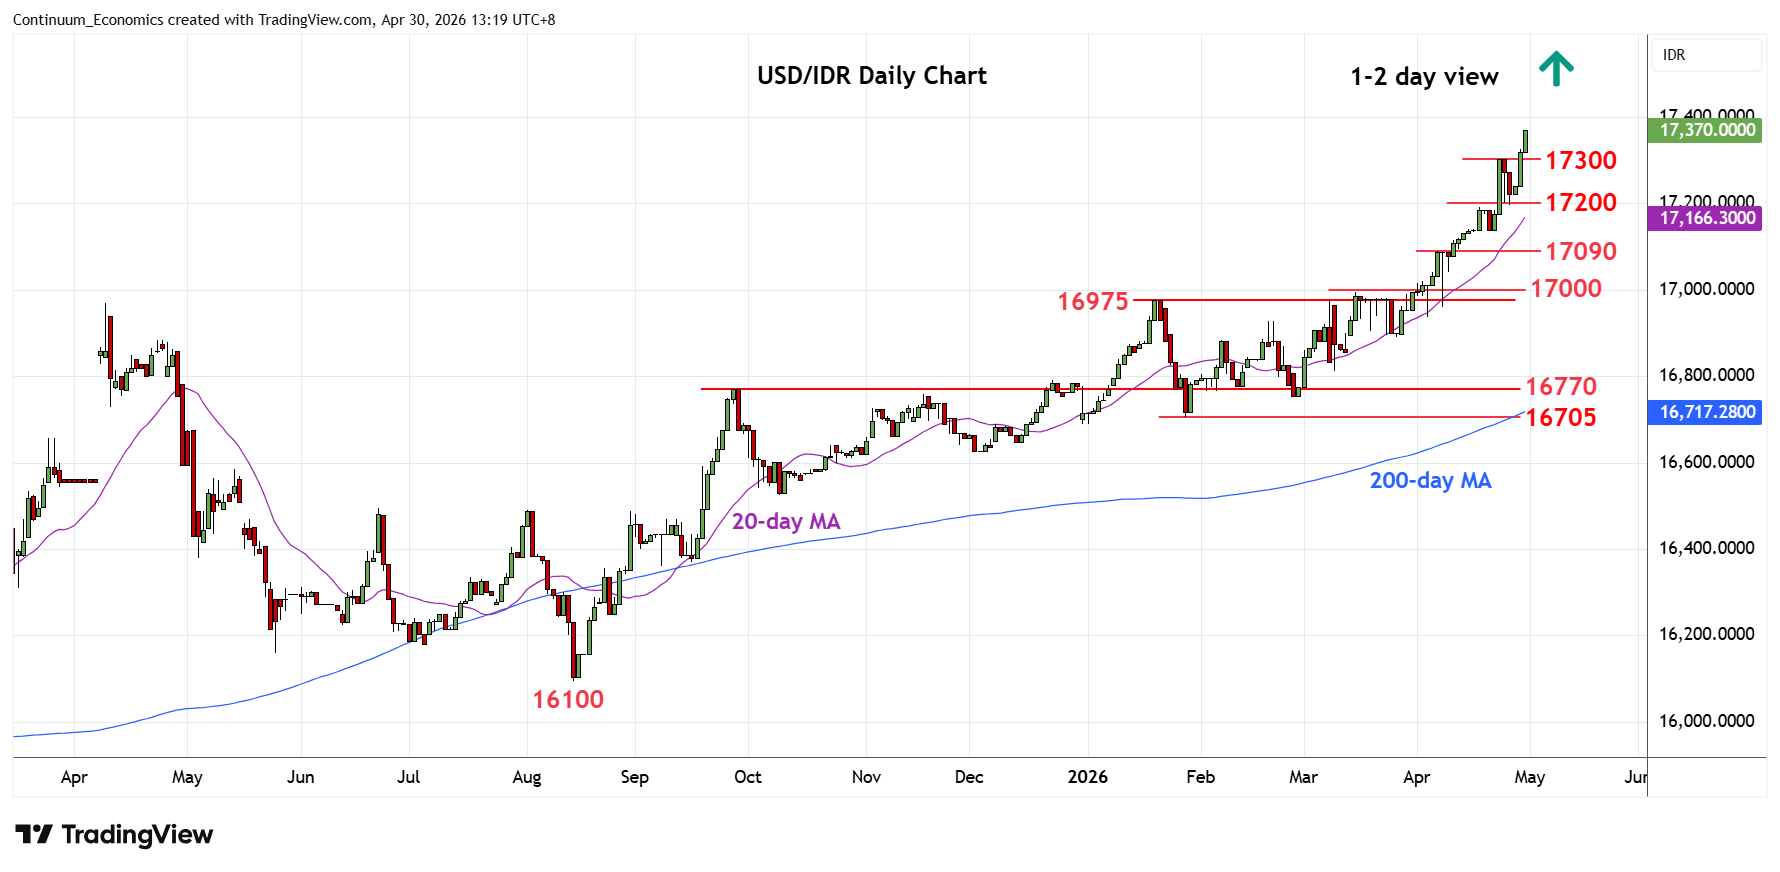
Extending break of the 17300 high of last week to reach fresh historic high at 17370
| Levels | Imp | Comment | Levels | Imp | Comment | |||
|---|---|---|---|---|---|---|---|---|
| R4 | 18000 | figure | S1 | 17300 | * | 23 Apr high | ||
| R3 | 17600 | projection | S2 | 17200 | * | congestion | ||
| R2 | 17500 | projection | S3 | 17137 | 17 Apr low | |||
| R1 | 17370 | intraday high | S4 | 17100/090 | ** | congestion, 7 Apr high |
Asterisk denotes strength of level
05:25 GMT - Extending break of the 17300 high of last week to reach fresh historic high at 17370. Higher will see room for extension to the 17500 and 17600 projection targets. Gains beyond this, if seen, will see room to the 18000 figure. However, the deep overbought daily and weekly studies caution corrective pullback with the 17300 high of last week now turned support. Below here will open up room for deeper corrective pullback to 17200/17190 congestion and 17 April high. Lower still, will open up room for deeper correction of gains from the 16705 January current year low.