Published: 2025-11-19T05:55:46.000Z
Chart USD/IDR Updates: Poised for retest of 16770, September high
1
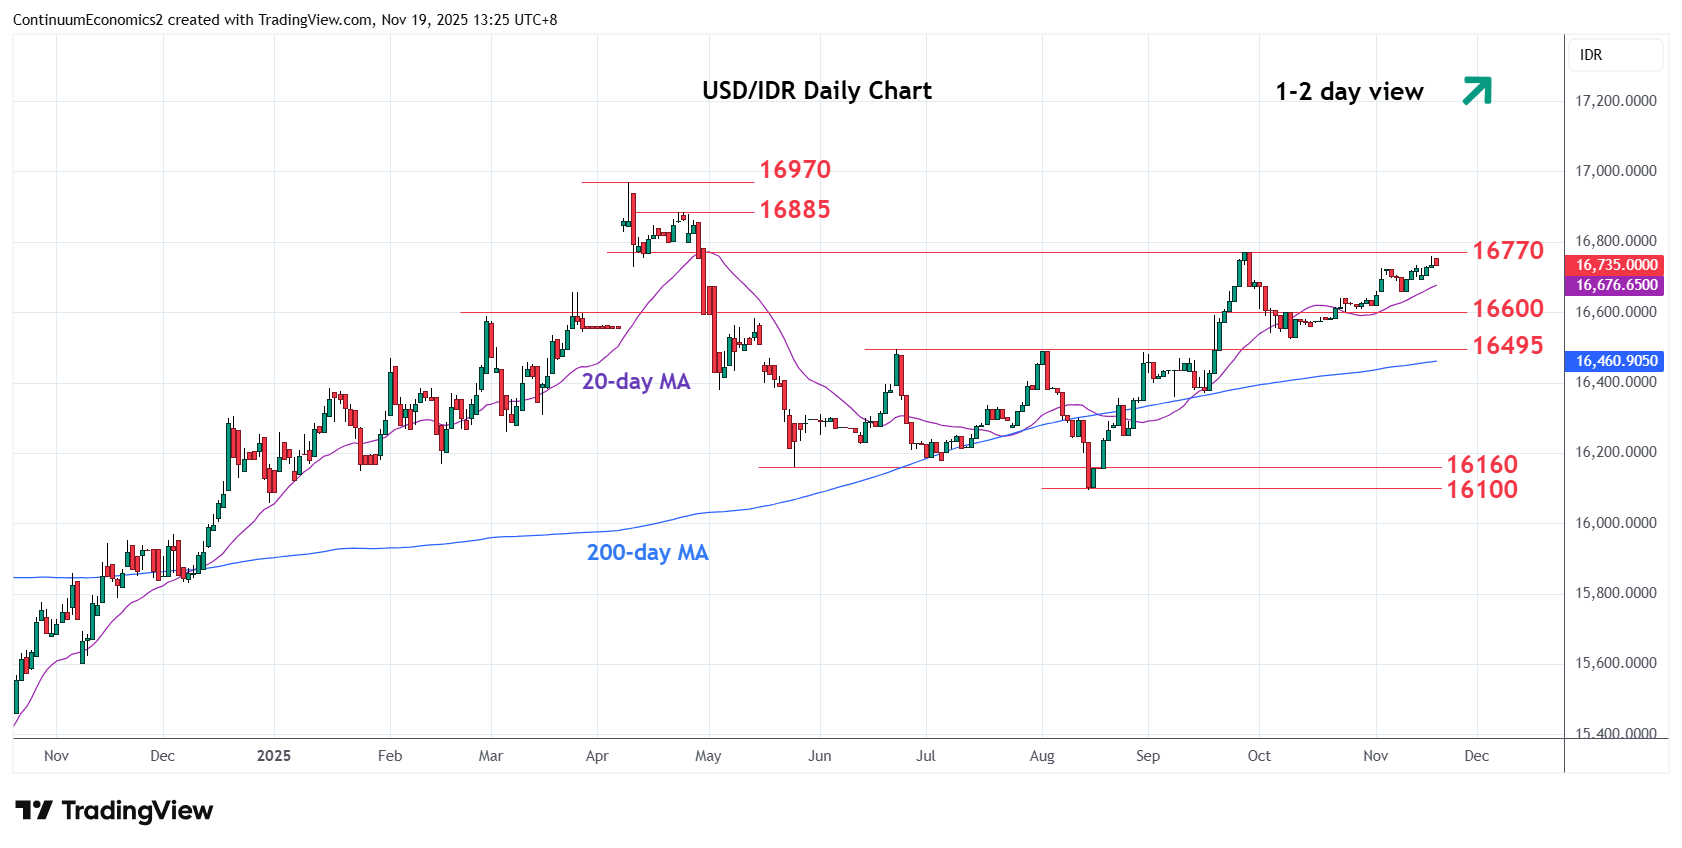
Break above 16725 high see prices extending gains from the 16525 October low towards the 16770, September high
| Levels | Imp | Comment | Levels | Imp | Comment | |||
|---|---|---|---|---|---|---|---|---|
| R4 | 16970 | ** | 9 Apr all-time high | S1 | 16660 | * | 10 Nov low | |
| R3 | 16885 | * | 23 Apr high | S2 | 16600 | * | congestion | |
| R2 | 16800 | * | congestion | S3 | 16525 | * | Oct low | |
| R1 | 16770 | ** | Sep high | S4 | 16495 | ** | Jun high |
Asterisk denotes strength of level
05:50 GMT - Break above 16725 high see prices extending gains from the 16525 October low towards the 16770, September high. Would expect reaction here but a later clearance cannot be ruled out. Higher will extend the broader gains from the August current year low at 16100 towards 16800 level then the late-April high at 16885. Beyond this will return focus to 16970, 9 April all-time high. Meanwhile, support at the 16700/16660 area is expected to underpin. Break here will ease the upside pressure and see room for deeper pullback to retrace gains from the 16525, October low.