Published: 2026-03-30T02:59:18.000Z
Chart USD/THB Update: Consolidating retest of 33.00/05 highs
1
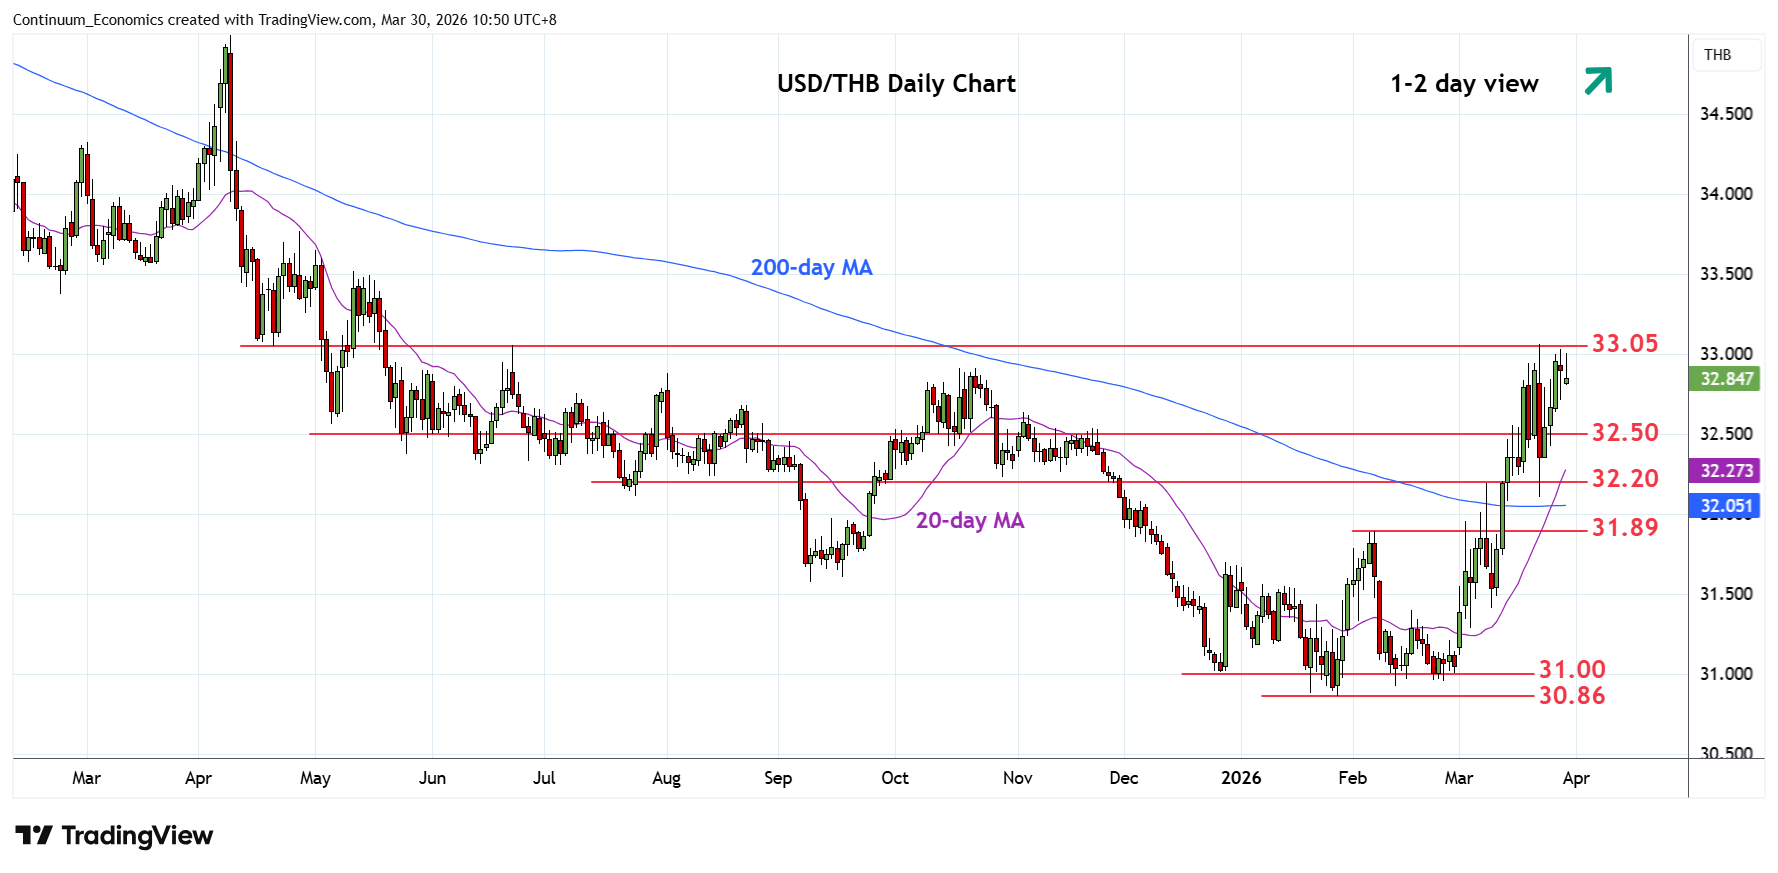
Consolidating retest of the 33.00/05 resistance and current year high
| Level | Comment | Level | Comment | |||||
|---|---|---|---|---|---|---|---|---|
| R4 | 33.50 | * | congestion | S1 | 32.50/35 | * | congestion | |
| R3 | 33.42 | * | 61.8% 2025/Jan fall | S2 | 32.20 | * | congestion | |
| R2 | 33.20 | * | congestion | S3 | 32.10 | * | 23 Mar low | |
| R1 | 33.00/05 | ** | figure, 23 Mar YTD high | S4 | 31.89 | ** | Feb high |
Asterisk denotes strength of level
02:50 GMT - Consolidating retest of the 33.00/05 resistance and current year high as prices unwind overbought intraday studies. Daily studies are stretched as well and caution corrective pullback to support at the 32.50/32.35 congestion area which should underpin. Would take break here to fade the upside pressure and open up room for deeper pullback to support at the 32.20 congestion and 32.10 low. Break above the 33.00/05 resistance, if seen, will further retrace losses from the March 2025 year high and see room to resistance at the 33.20 congestion.