Published: 2026-03-13T03:12:35.000Z
Chart USD/THB Update: Retest 32.20 high, room for higher
1
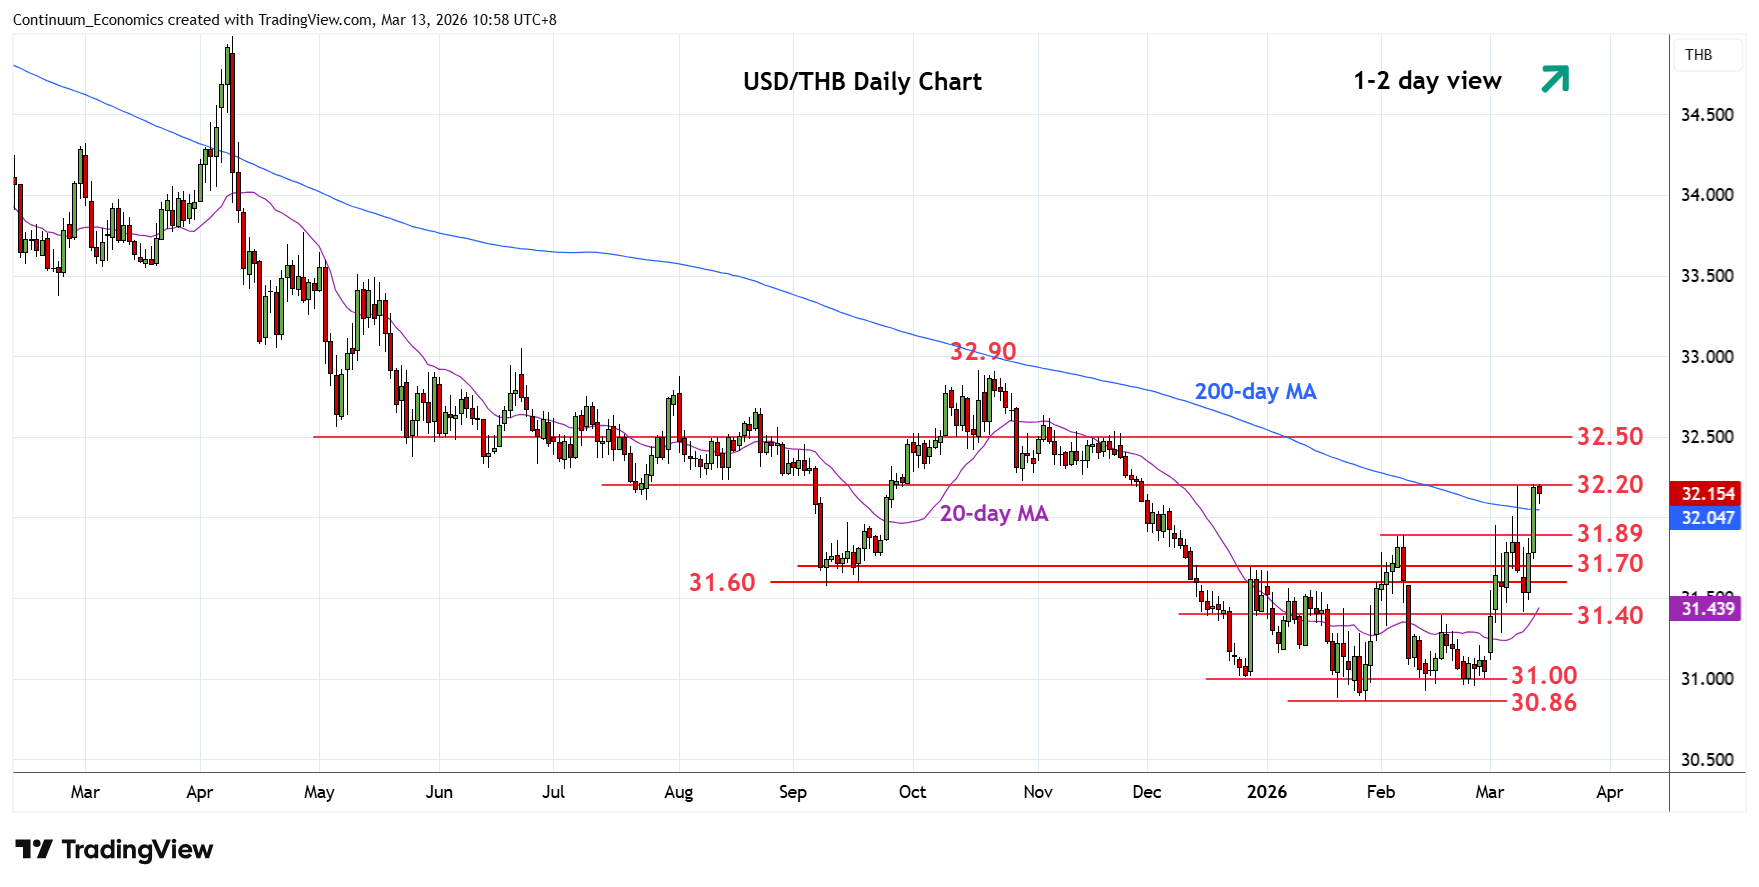
Bounce from the 31.40 support has seen prices retracing all of the losses to retest the 32.20, Monday's high
| Level | Comment | Level | Comment | |||||
|---|---|---|---|---|---|---|---|---|
| R4 | 32.50 | * | congestion | S1 | 32.00 | * | congestion | |
| R3 | 32.44 | * | 38.2% 2025/Jan fall | S2 | 31.89 | ** | Feb high | |
| R2 | 32.40 | * | congestion | S3 | 31.70 | * | congestion | |
| R1 | 32.20/23 | ** | congestion, Oct low | S4 | 31.60/58 | ** | congestion, Sep low |
Asterisk denotes strength of level
03:10 GMT - Bounce from the 31.40 support has seen prices retracing all of the losses to retest the 32.20, Monday's high. Positive daily and weekly studies highlight scope for break here and the 32.23 resistance to extend gains from the double bottom at the 30.93/30.86, February/January lows. Higher will further retrace losses from the April high to the 32.40 congestion and 32.44, 38.2% Fibonacci level. Meanwhile, support is raised to the 32.00 congestion which extend to the 31.89 February high, which should underpin and limit any corrective pullback.