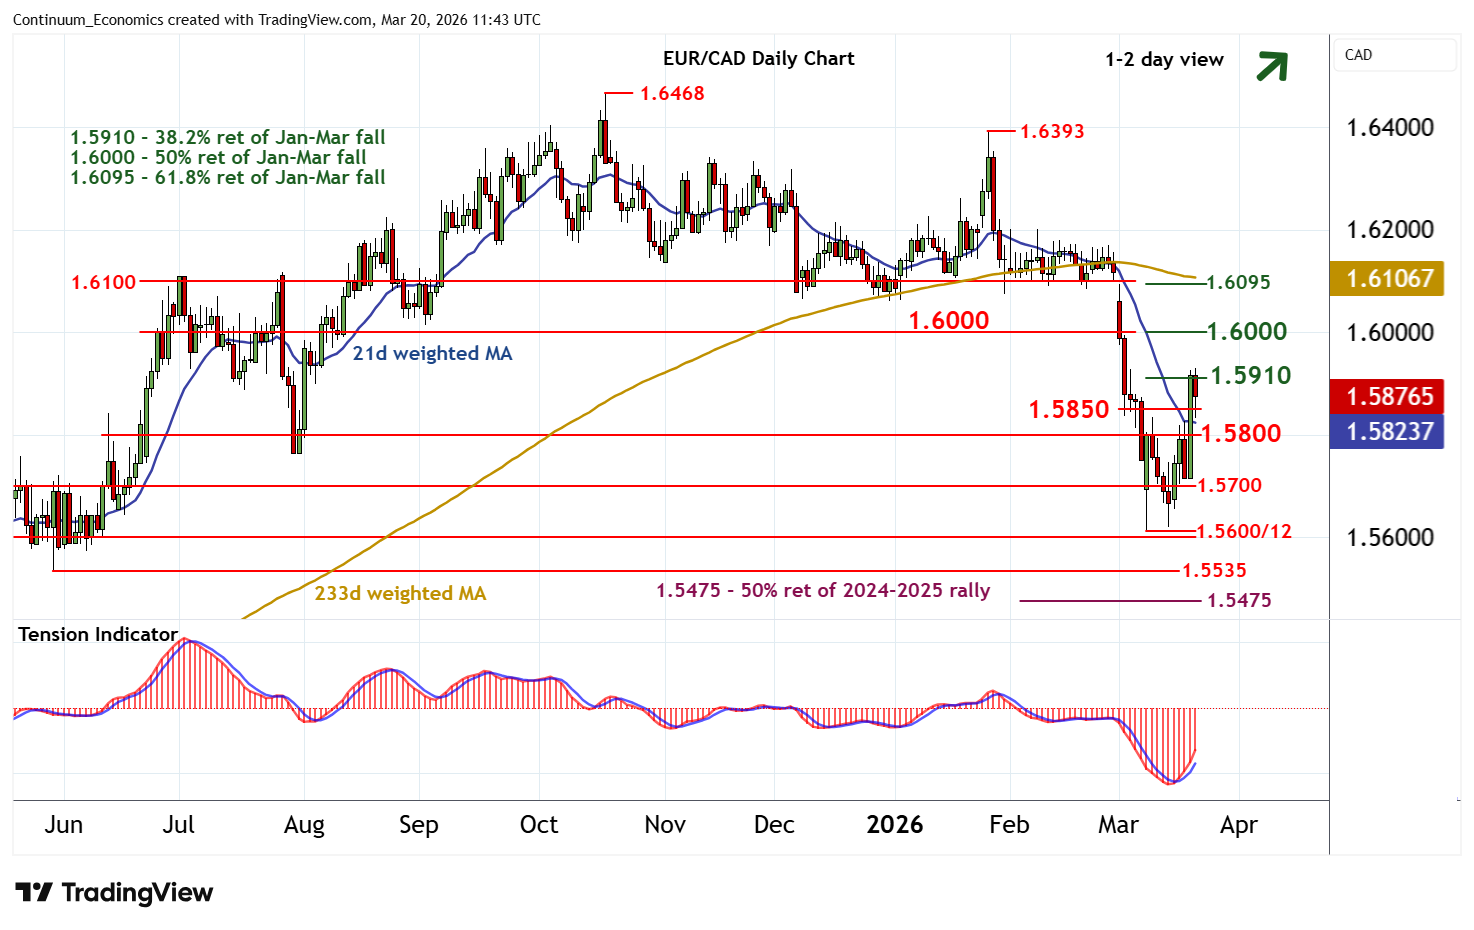
Chart EUR/CAD Update: Consolidating test of the 1.5910 Fibonacci retracement
Anticipated gains have extended to the 1.5910 Fibonacci retracement
| Level | Comment | Level | Comment | |||||
|---|---|---|---|---|---|---|---|---|
| R4 | 1.62000 | ** | congestion | S1 | 1.5850 | minor congestion | ||
| R3 | 1.6095/00 | ** | 61.8% ret; break level | S2 | 1.5800 | * | congestion | |
| R2 | 1.6000 | ** | congestion, 50% ret | S3 | 1.5700 | * | congestion | |
| R1 | 1.5910 | * | 38.2% ret of Jan-Mar fall | S4 | 1.5600/15 | * | congestion; 9 Mar YTD low |
Asterisk denotes strength
11:25 GMT - Anticipated gains have extended to the 1.5910 Fibonacci retracement, where unwinding overbought intraday studies are prompting a pullback into consolidation around 1.5875. Daily readings continue to rise and oversold weekly stochastics are unwinding, highlighting room for further strength in the coming sessions. A close above 1.5910 will improve sentiment and extend March gains towards 1.6000. However, already overbought daily stochastics and the negative weekly Tension Indicator should limit any initial tests in renewed consolidation. Meanwhile, support is raised to congestion around 1.5850. A break beneath here, if seen, will turn sentiment neutral and prompt consolidation above further congestion around 1.5800.