Published: 2026-02-25T03:15:01.000Z
Chart USD/CNH Update: Extending losses
1
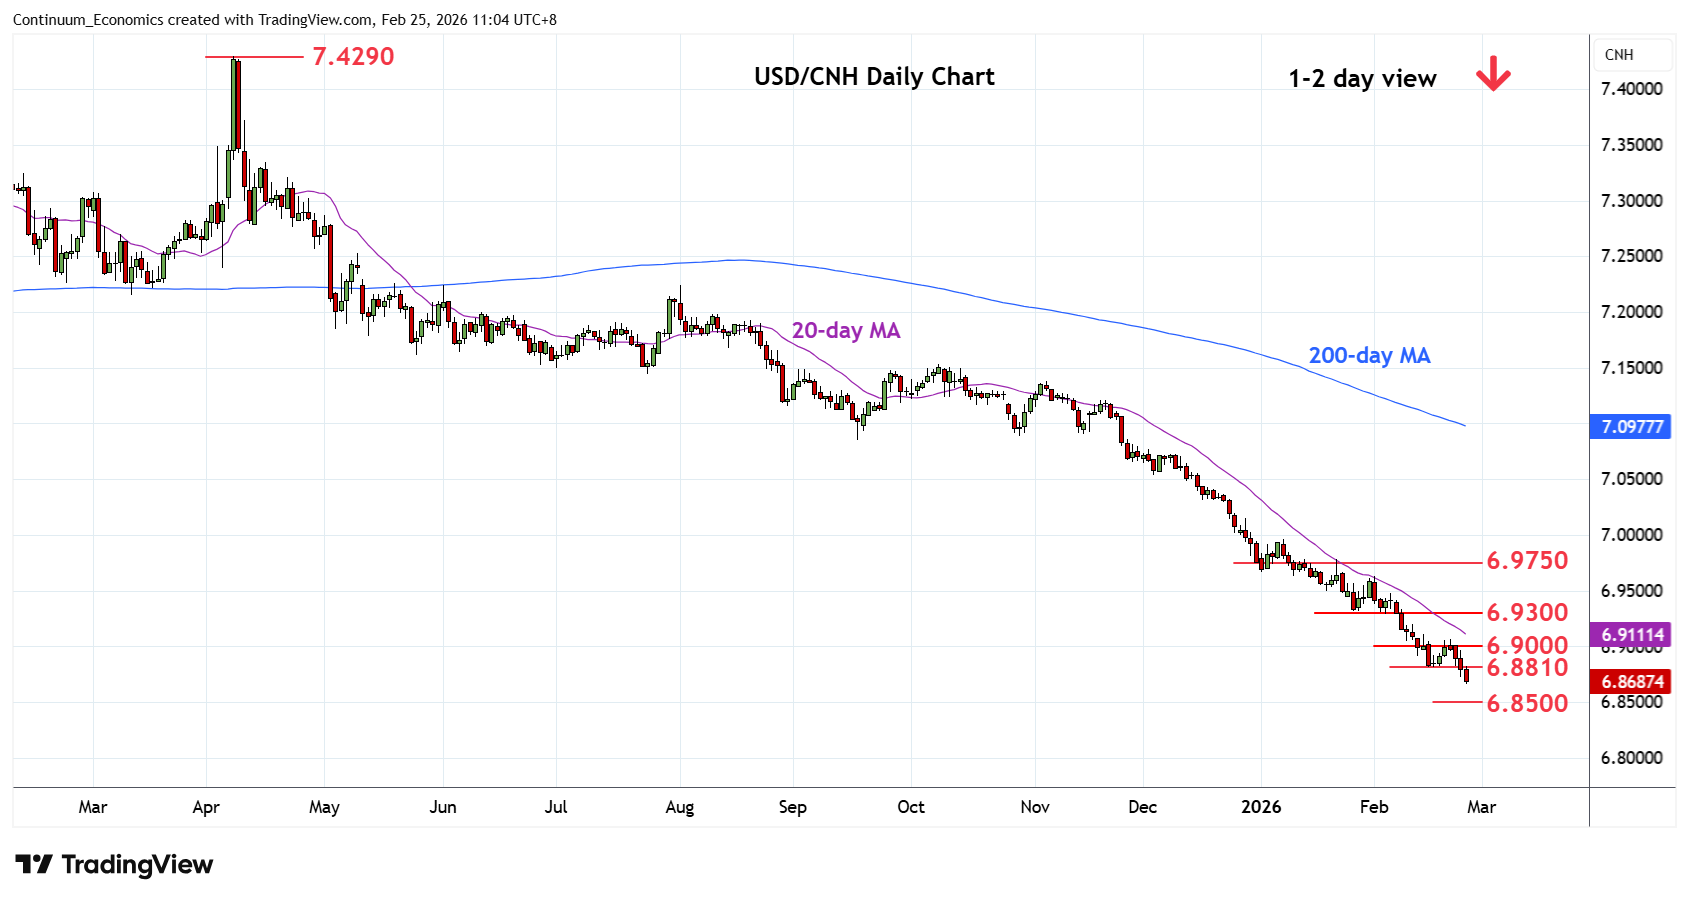
Break of the 6.8810 support see prices extending losses to reach the 6.8700, 76.4% Fibonacci level
| Level | Imp | Comment | Level | Imp | Comment | |||
|---|---|---|---|---|---|---|---|---|
| R4 | 6.9500 | * | congestion | S1 | 6.8700 | * | 76.4% 2023/2025 rally | |
| R3 | 6.9300 | * | Jan low, congestion | S2 | 6.8500 | * | congestion | |
| R2 | 6.9000/65 | ** | congestion, 20 Feb high | S3 | 6.8100 | * | Mar 2023 low | |
| R1 | 6.8800/10 | * | congestion, 16 Feb low | S4 | 6.8000 | ** | figure, congestion |
Asterisk denotes strength of level
03:10 GMT - Break of the 6.8810 support see prices extending losses to reach the 6.8700, 76.4% Fibonacci level. Below this will see extension of losses from April 2025 year high and see room to target 6.8500 congestion. Deep oversold daily and weekly studies suggest reaction at the latter likely to correct sharp losses from the January current year high at 6.9960. Meanwhile, resistance is lowered to the 6.8800/10 congestion area which is expected to cap. Would need to regain this to open up room for stronger bounce to the 6.9000/6.9065 area.