Published: 2026-03-18T03:11:53.000Z
Chart USD/THB Update: Leaning lower from 32.55 highs
1
Double rejection from the 32.55 current year high threatens pullback to the 32.20 support
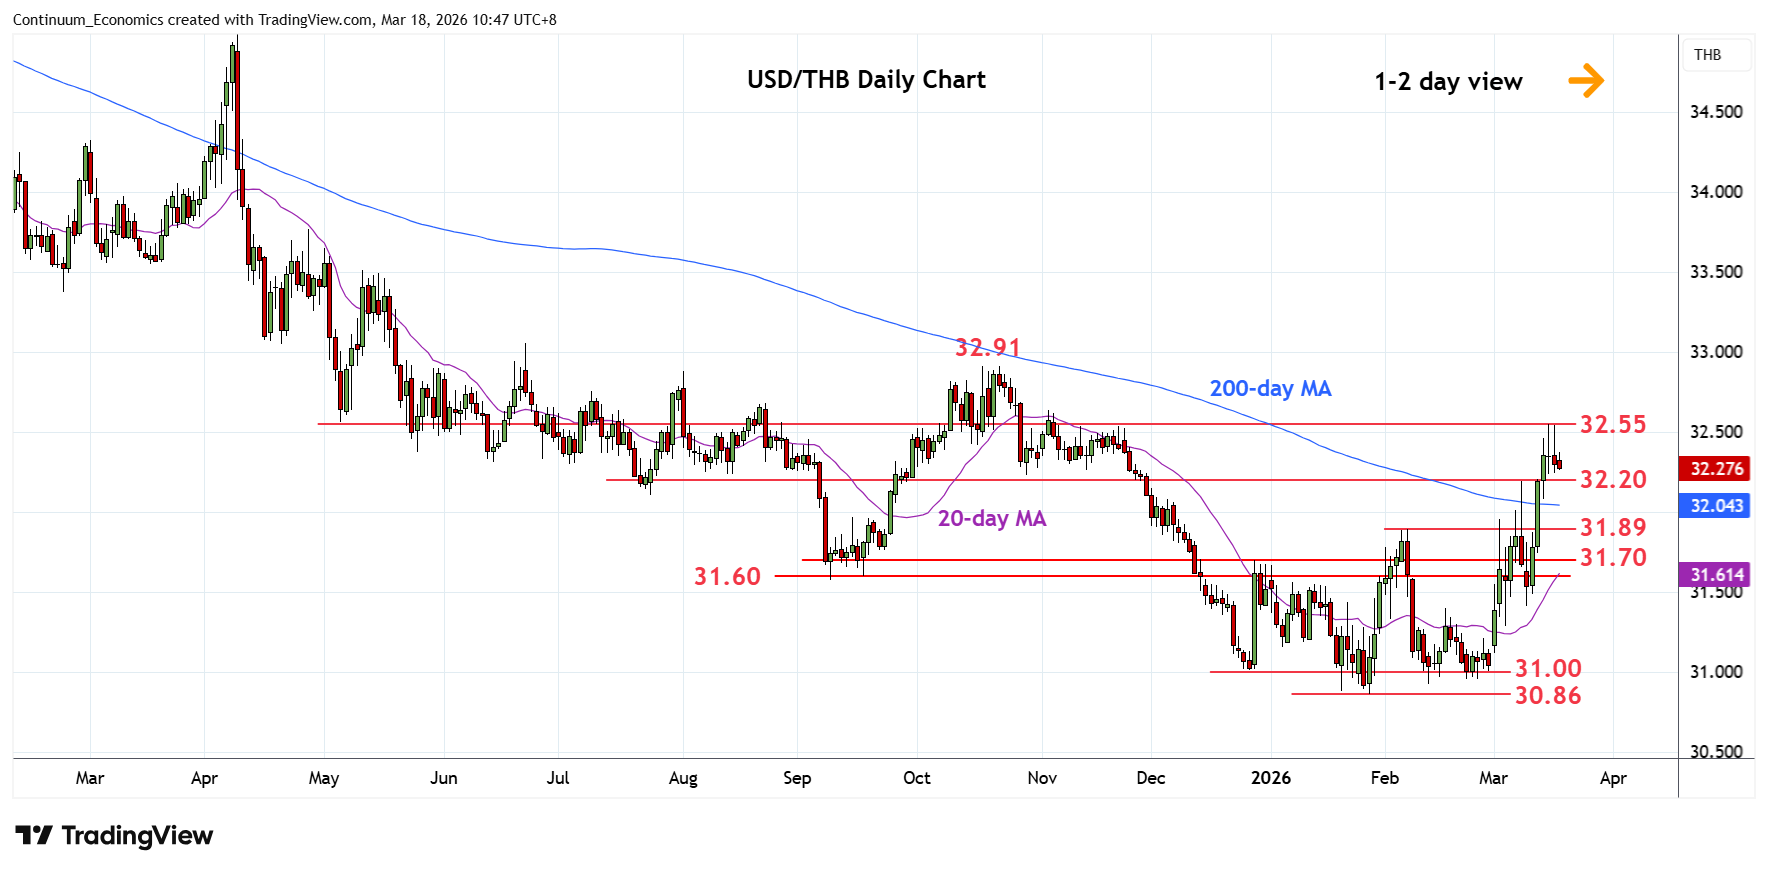
| Level | Comment | Level | Comment | |||||
|---|---|---|---|---|---|---|---|---|
| R4 | 32.91/93 | ** | Oct high, 50% | S1 | 32.20 | * | congestion | |
| R3 | 32.80 | * | congestion | S2 | 32.00 | * | congestion | |
| R2 | 32.63 | * | Nov high | S3 | 31.89 | ** | Feb high | |
| R1 | 32.55 | * | 16 Mar YTD high | S4 | 31.70 | * | congestion |
Asterisk denotes strength of level
03:10 GMT - Double rejection from the 32.55 current year high threatens pullback to the 32.20 support as intraday and daily studies unwind overbought readings. Break here will open up room for deeper pullback to support at the 32.00 level and strong support at the 31.89, February high. Below the latter will return focus to the downside to retrace strong gains from the 31.00/30.86, February/January lows. Meanwhile, resistance at the 32.55 high is expected to cap and sustain bearish structure from the April 2025 year high.