Published: 2026-02-04T04:26:54.000Z
Chart USD/IDR Updates: Extend consolidation below 16800
2
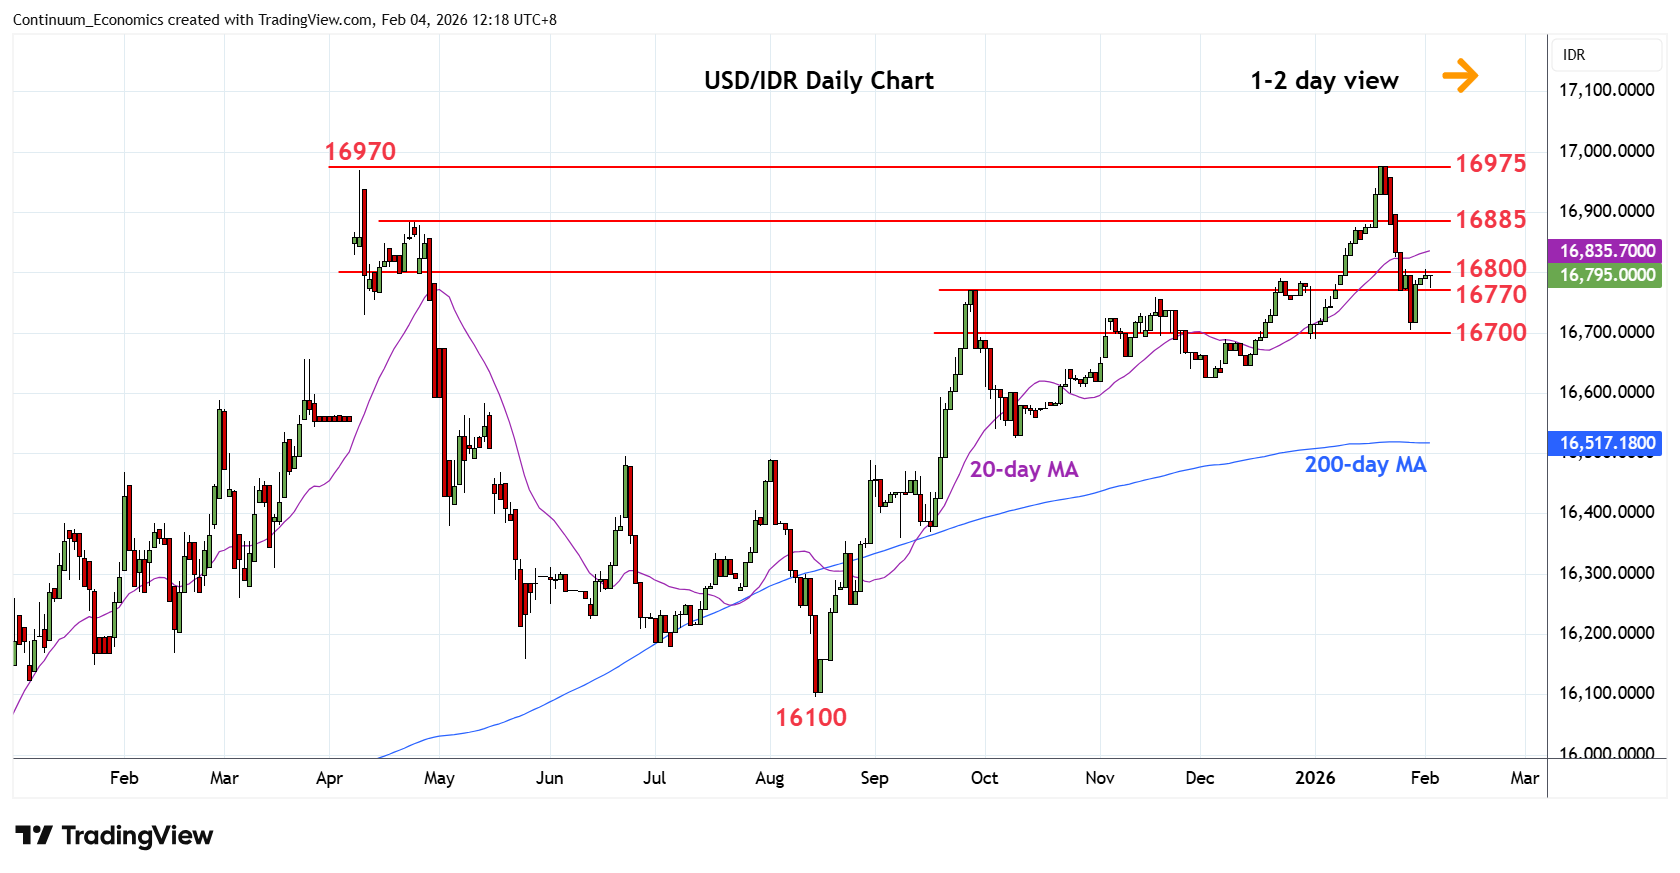
Little change, as prices extend consolidation below the 16800 resistance
| Levels | Imp | Comment | Levels | Imp | Comment | |||
|---|---|---|---|---|---|---|---|---|
| R4 | 17050 | * | projection | S1 | 16705 | ** | Jan low | |
| R3 | 16975 | ** | 20 Jan all-time high | S2 | 16690 | * | 31 Dec low | |
| R2 | 16885 | * | 23 Apr high | S3 | 16640 | * | 38.2% Aug/Jan rally | |
| R1 | 16800 | ** | congestion | S4 | 16625/00 | * | Dec, Nov lows |
Asterisk denotes strength of level
04:20 GMT - Little change, as prices extend consolidation below the 16800 resistance. While the latter caps scope is seen for pullback to retest the 16705 low and 16990 support. Break of these will open up room for deeper pullback to retrace the August/January gains and see extension to support at 16640, 38.2% Fibonacci level. Lower still, will see room to strong support at 16625/16600, December/November lows. Would take break above 16800 resistance to open up room for extension to retest the 16885/16900 area.