Macro and Market Implications of 'Super' El Nino Risks
El Nino, and a potentially severe one, is increasingly looking like a central scenario rather than a tail risk for 2026-27.
2026-27 El Nino is shaping up to be strong enough to matter, at least for scenario planning.
The key facts are broadly: Australia, New Zealand, Indonesia and South Africa are likely among the clearest growth losers; commodity prices face upward pressure; inflation effects are largest where food weights are high; and outlier ‘high standard deviation’ events can create lasting losses.
The market implication is not to trade El Nino mechanically, but to recognise that a high-intensity event can reinforce existing macro vulnerabilities, corrective trends, and tactical bets, and make some otherwise modest forecast tilts more asymmetric.
The latest official Oceanic Niño index (ONI) reading is still only around +0.5C for the three months to May, but the timelier readings are already stronger: The International Research Institute for Climate (IRI) puts May alone close to +1C, with a weekly Nino 3.4 reading centred on June 17 near +1.7C. The Southern Oscillation Index (SOI) tracking is also consistent with a move into El Nino.
Figure 1: Monthly SOI Paths
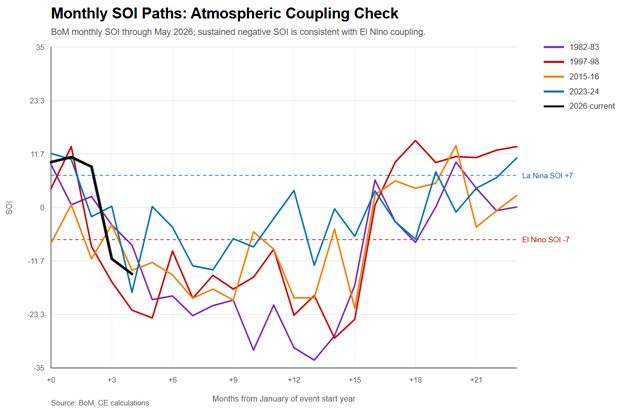
Source: BoM, CE
The June forecast summary puts El Nino probabilities at 100% from June-August through the autumn and virtually 100% through the winter. But the issue is not only the unusual level of certainty, it’s also scale. The National Oceanic and Atmospheric Administration (NOAA/CPC) assigns a near two-in-three chance to a very strong event in November-January, which would place it among the strongest events in post-1950 records, while the June IRI plume has the majority of models taking Nino 3.4 to at least +2.0C in Sep-Nov. In other words, the relevant macro question is not only whether El Nino develops, but whether markets should begin pricing a high-intensity event.
Figure 2: El Nino intensity: ONI / El Nino 3.4 trajectory and projections vs prior major events
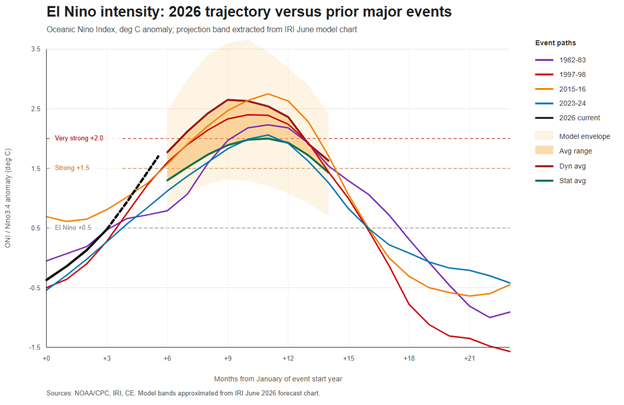
Source: NOAA/CPC, IRI, CE
The impact of past events is highly contextual, depending on the prevailing environmental backdrop and the macro and market vulnerabilities in place at the time. That makes it hard to draw clean generalised conclusions. Still, there are a couple of standard reference papers that provide useful framing on the key channels and the varied nature of the global impact.
IMF WP/15/89, "Fair Weather or Foul? The Macroeconomic Effects of El Nino", is perhaps the baseline text. It estimates the impact of a one-standard-deviation El Nino shock across growth, inflation and commodity prices.
In that model, after four quarters a mid-sized El Nino shock lowers real GDP growth by roughly 0.4pp in Australia, 0.4pp in New Zealand, 1.0pp in Indonesia, 0.7pp in South Africa and a more modest 0.25pp in India.
Figure 3: IMF model projections for 4-qtr growth and inflation impacts, 1 stdev event
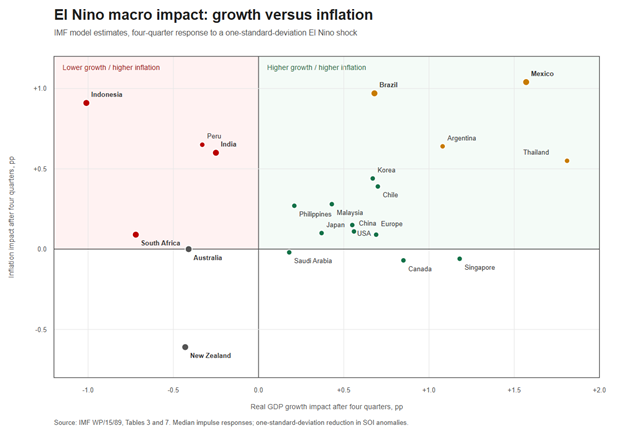
Source: IMF WP/15/89, CE
Net positive effects are estimated for Canada at around +0.85pp, the US +0.55pp, Mexico +1.6pp, Argentina +1.1pp and Thailand +1.8pp after four quarters. Europe also appears as a net gainer in the model albeit this more through assumed external spillover effects. Milder winters can help fuel costs in some locations, including Europe and Japan, albeit with offsets from food prices.
On the commodity side, the IMF estimates that a one-standard-deviation El Nino shock raises real non-fuel commodity prices by 5.3% after four quarters and, perhaps more surprisingly, real oil prices by 13.9%. Food and agriculture are the clearest channels, but energy can matter through hydro shortfalls, irrigation demand and substitution effects. This year, the interaction with the Iran-war hangover also matters, particularly given the severe fertiliser supply shortages seen during a critical window.
On inflation, the food weight in the CPI basket is the dominant influence. Indonesia, India and Thailand have the largest Asian responses in the IMF paper; Mexico is also large, while Brazil and Peru show meaningful later effects. The US and Europe responses are much smaller, Canada is neutral in the model, and New Zealand is the main disinflationary standout via the growth channel.
Schematically, it is useful to think about this in quadrant terms. In the majors, the growth-inflation mix is relatively bond-positive and exchange-rate negative for New Zealand, while for Australia the growth hit can also dominate on both. Canada is the clearest major-market macro beneficiary in the model, although in market terms that effect is likely to remain secondary to the global dollar cycle, oil price action and US trade negotiations.
Among EM, a severe event is best thought of as a stagflation-skewed macro shock and income hit rather than a generic beta story. It could re-aggravate Indonesia's vulnerabilities after the recent geopolitical pressure, chip away at South Africa's recent performance and complicate the rates channel in India. Thailand and Mexico look more reflationary (growth and inflation positive), while Brazil is more mixed across its regions and agricultural sectors but still nets out as somewhat inflationary.
Figure 4: Maximum and average peak FX moves over prior selected strong/super events windows
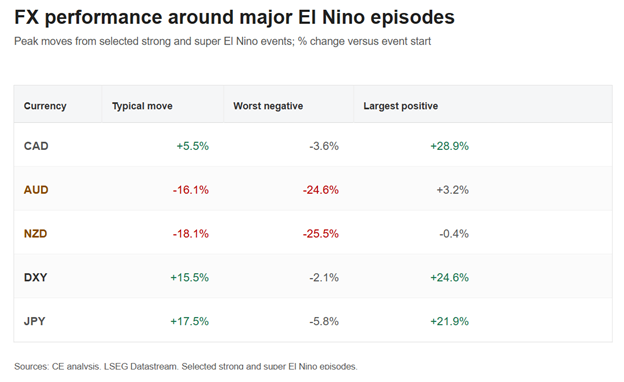
Source: Datastream, CE
Scale matters. The IMF estimates are based on a one-standard-deviation shock, while the upside scenario this year is skewing towards the upper tail of major historical events, so potentially 2 standard deviations. The effects should not be assumed to scale mechanically, but a stronger event makes larger macro and market consequences more likely.
Callahan and Mankin's "Persistent effect of El Nino on global economic growth" makes that point in a different way. It argues that the biggest El Nino events leave lasting output scars, estimating global income losses of about $4.1tn after the 1982-83 event and $5.7tn after 1997-98 over subsequent years.
Historical analogues are useful but imperfect. 1982-83 is the best Australian physical stress case, but it came in a multi-year period of drought stress and the Australian dollar was not yet freely floating. 1997-98 is the best strong global market-era case, but it is contaminated by the Asian crisis. 2015-16 is the best recent example, but it overlaps with China weakness, the commodity downturn and Fed tightening. Indeed, pretty much every event is swamped by other key drivers over the encompassing window. Still, the major past events help frame the extent to which El Nino can aggravate and be compounded by prevailing stresses.
Figure 5: Example AUD/USD trajectories over prior selected strong/super events
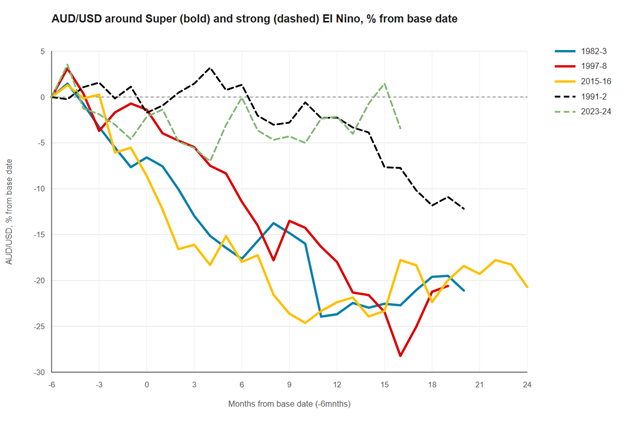
Source: Datastream, CE
With that event-contamination proviso in mind, past strong and super El Nino windows show a directional pattern in favour of AUD and NZD weakness against USD, DXY strength, and JPY often performing well when the shock overlaps with risk-off or carry unwind. Whether that risk-off quality can be regained this time remains to be seen. The sample is small and heavily affected by other shocks, but the tendency fits the macro evidence. It makes sense therefore to factor in some corrective downside pressure over H2 for some otherwise favoured commodity names while allowing for a more severe downside-risk scenario that could drive sharper counter-consensus price action. USD can benefit if El Nino reinforces food-price risk, weaker high-beta growth exposure and tighter financial conditions.
The EM impact is not generic. It is most relevant where food inflation reduces easing space, weakens real incomes or interacts with external pressure.
Indonesia might be the cleanest case. The IMF finds a large negative growth effect, a sizeable inflation effect and direct commodity channels through palm oil, coffee, cocoa, hydropower and nickel. That mix could prove a key risk scenario. Even if Iran impacts unwind, markets should be cautious about the length and extent of any easing in Indonesian risk premia if a fresh local weather shock emerges.
South Africa, reflecting hot and dry El Nino summers and the drag on agriculture, may also need to factor in downside risks from a severe episode, tempering an otherwise constructive story.
India is more nuanced. The modelled growth hit is smaller, helped by irrigation, crop switching and food stocks, but food inflation can still matter through the rates channel. Mexico, depending on how trade negotiations evolve (here), has one of the highest potential nominal growth impulses and could outperform on some crosses. Indeed, ‘El Nino cross trades’ might emerge as one popular thematic idea later in the year.
In sum, El Nino is not a standalone event in a silo, and its details are not predictable - even in weather-outturn terms in fact. This year, for instance, heavy recent rain in the East has provided a welcome buffer for Australia and sees it enter in a much healthier soil moisture state than the 1980s. Crop rotation is also another mitigating factor. Even so, ongoing water stress in agriculturally important Western Australia remains, while extremes during the grain filling part of the cycle can still undermine benefits from a wetter winter. India meanwhile starts with below normal rainfall but high grain and rice stocks.
The fact remains this event is strong enough to matter, at least for scenario planning. The key facts are broadly concrete: Australia, New Zealand, Indonesia and South Africa are among the clearest growth losers; commodity prices face upward pressure; inflation effects are largest where food weights are high; and outlier ‘high standard deviation’ events can create lasting losses. The market implication is not to trade El Nino mechanically, but to recognise that a high-intensity event can reinforce existing macro vulnerabilities, corrective trends, and tactical bets, and make some otherwise modest forecast tilts more asymmetric.