Published: 2026-02-27T04:45:37.000Z
Chart USD/MYR Update: Extending losses, but stretched
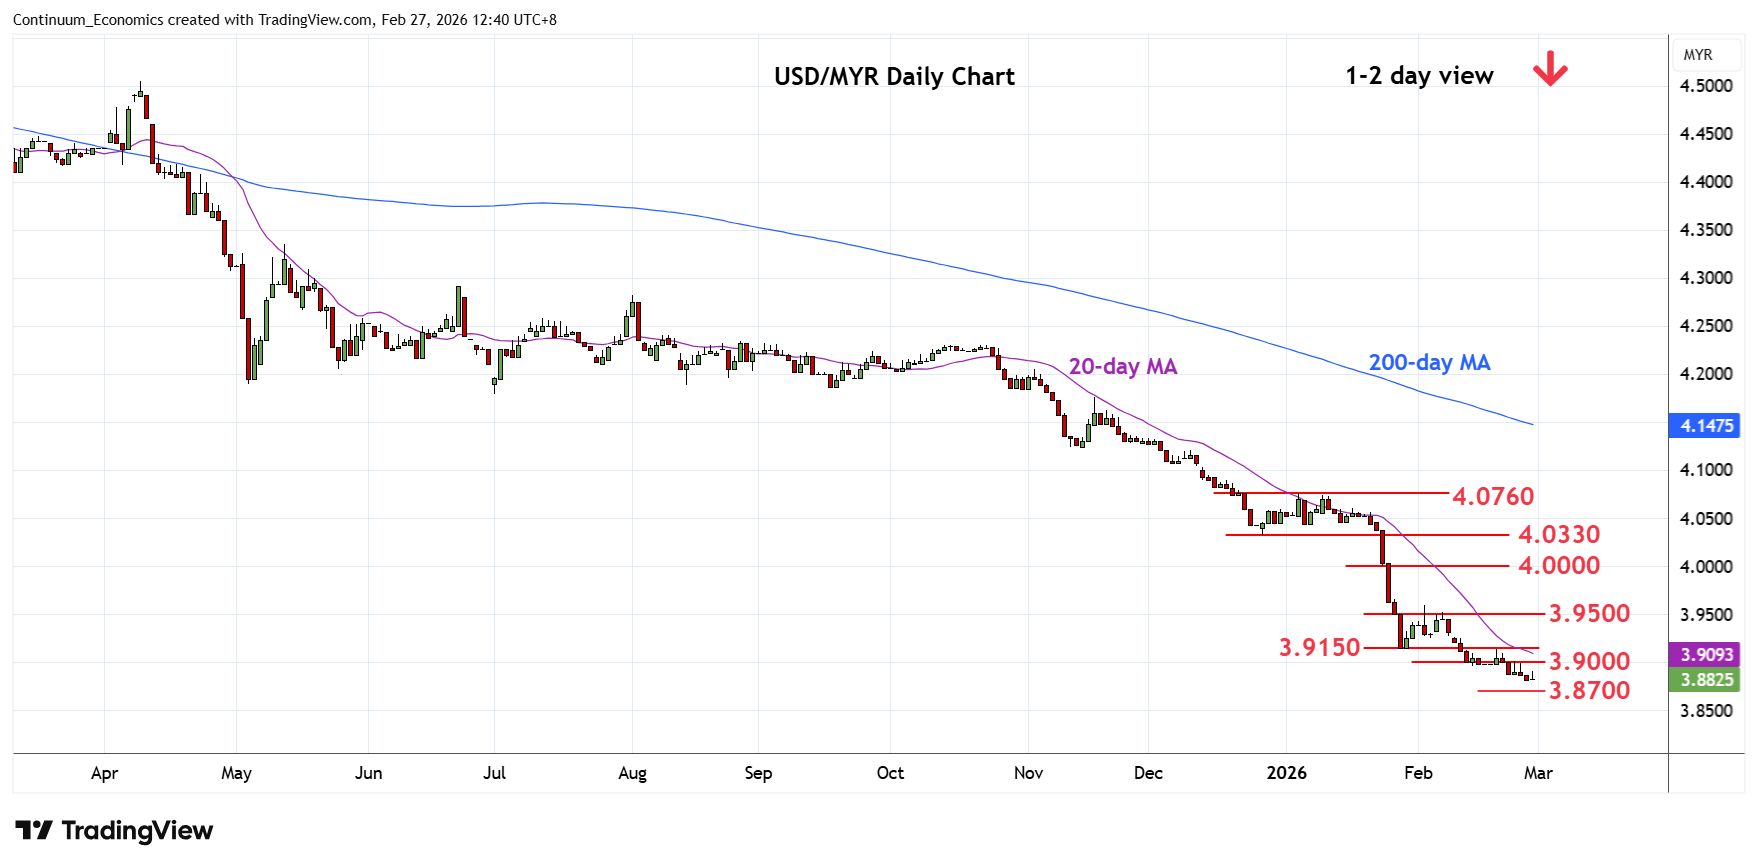
1
Pressure remains on the downside with losses reaching fresh year low at 3.8820
| Levels | Imp | Comment | Levels | Imp | Comment | |||
|---|---|---|---|---|---|---|---|---|
| R4 | 4.0000 | ** | figure, 2021 year low | S1 | 3.8700 | * | Jan 2018 low | |
| R3 | 3.9500 | * | congestion | S2 | 3.8560 | ** | Apr 2018 year low | |
| R2 | 3.9150 | * | Jan low | S3 | 3.8380 | ** | Apr 2016 year low | |
| R1 | 3.9000 | * | congestion | S4 | 3.8200 | * | congestion |
Asterisk denotes strength of level
04:40 GMT - Pressure remains on the downside with losses reaching fresh year low at 3.8820. Bearish structure see room to extend losses from the 2024 year high and lower will see room 3.8700, January 2018 low. Below this will turn focus to the April 2018 year low at 3.8560. However, deep oversold daily and weekly studies caution corrective bounce. Meanwhile, resistance remains at the 3.9000/3.9150 congestion and January low which is expected to cap. Would need lift over this to fade the downside pressure and open up room for stronger corrective bounce.