Published: 2026-04-28T02:28:50.000Z
Chart USD/SGD Update: Room to extend pullback from 1.2793 high
1
Turned down from the 1.2793 high of last week to break support at the 1.2750 congestion
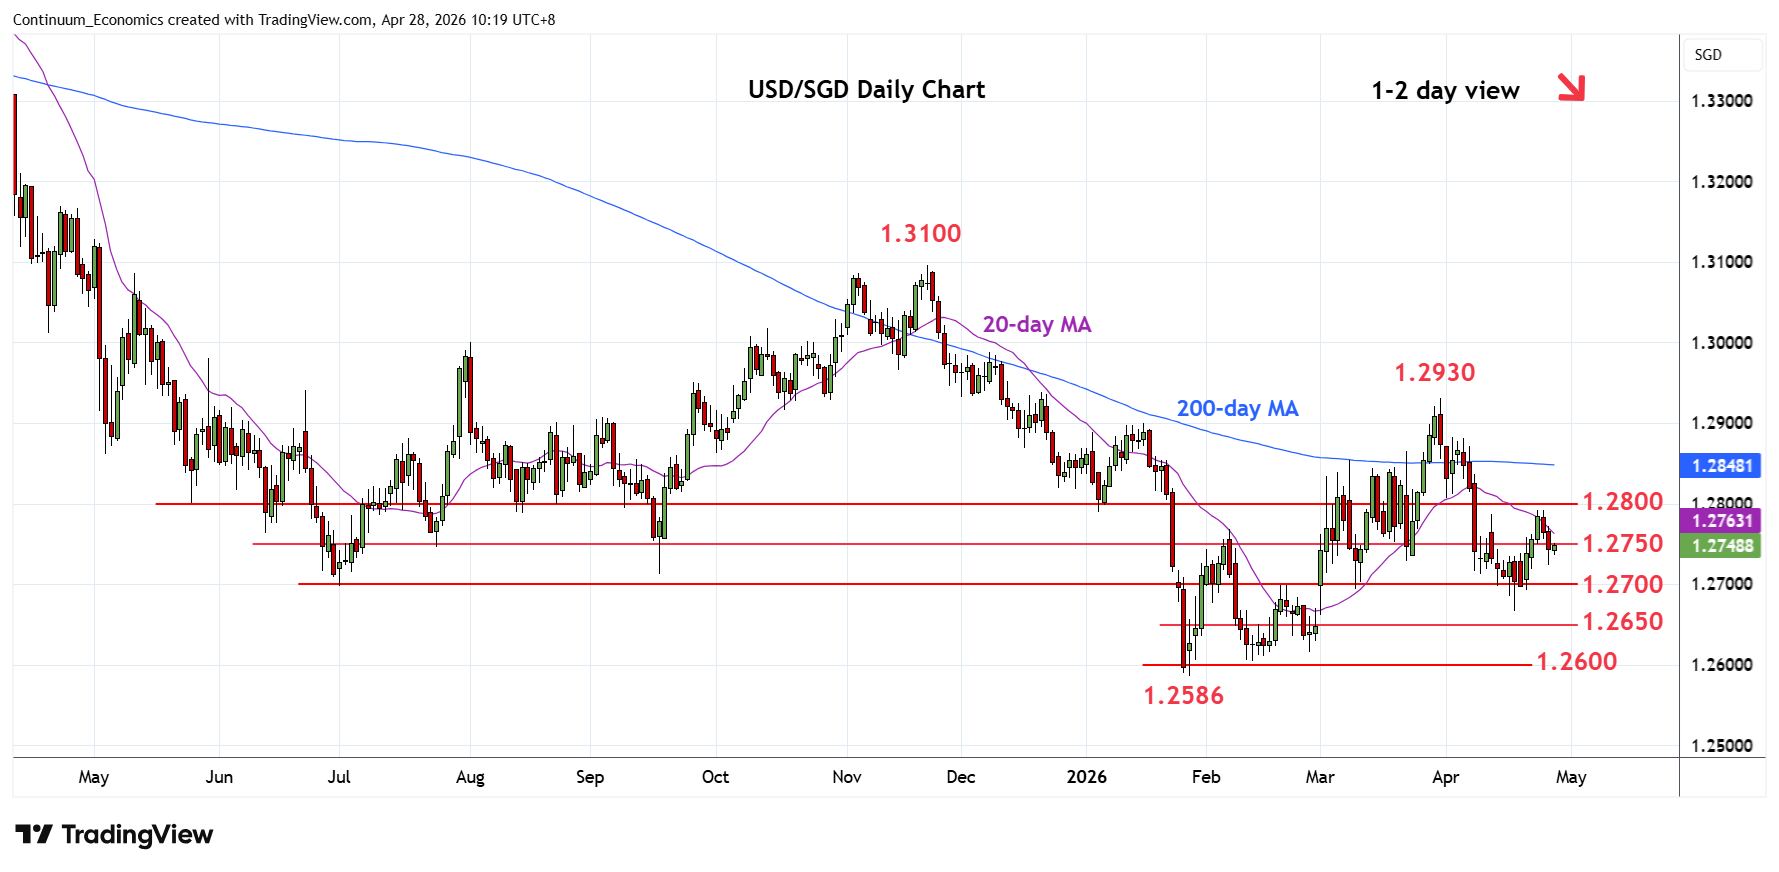
| Level | Comment | Level | Comment | ||||
|---|---|---|---|---|---|---|---|
| R4 | 1.2930 | ** | 31 Mar YTD high | S1 | 1.2700 | ** | 19 Feb high, 2025 yr low |
| R3 | 1.2900 | * | Jan high | S2 | 1.2667 | * | 17 Apr low |
| R2 | 1.2850 | * | congestion | S3 | 1.2650 | congestion | |
| R1 | 1.2800/07 | ** | congestion, 1 Apr low | S4 | 1.2600 | * | congestion |
Asterisk denotes strength of level
02:20 GMT - Turned down from the 1.2793 high of last week to break support at the 1.2750 congestion see prices unwinding overbought daily studies. Lower will see room to the 1.2700 level then the 1.2667, 17 April low. Break of the latter will see deeper pullback to retrace the January/March gains and see extension to 1.2650. Below this will open up room to retest the 1.2600 level then the 1.2586 low. Meanwhile, resistance at 1.2793 high and the 1.2800/07 resistance are expected to cap and sustain losses from 1.2930 March high.