Published: 2026-03-18T05:14:06.000Z
Chart USD/MYR Update: Under pressure
1
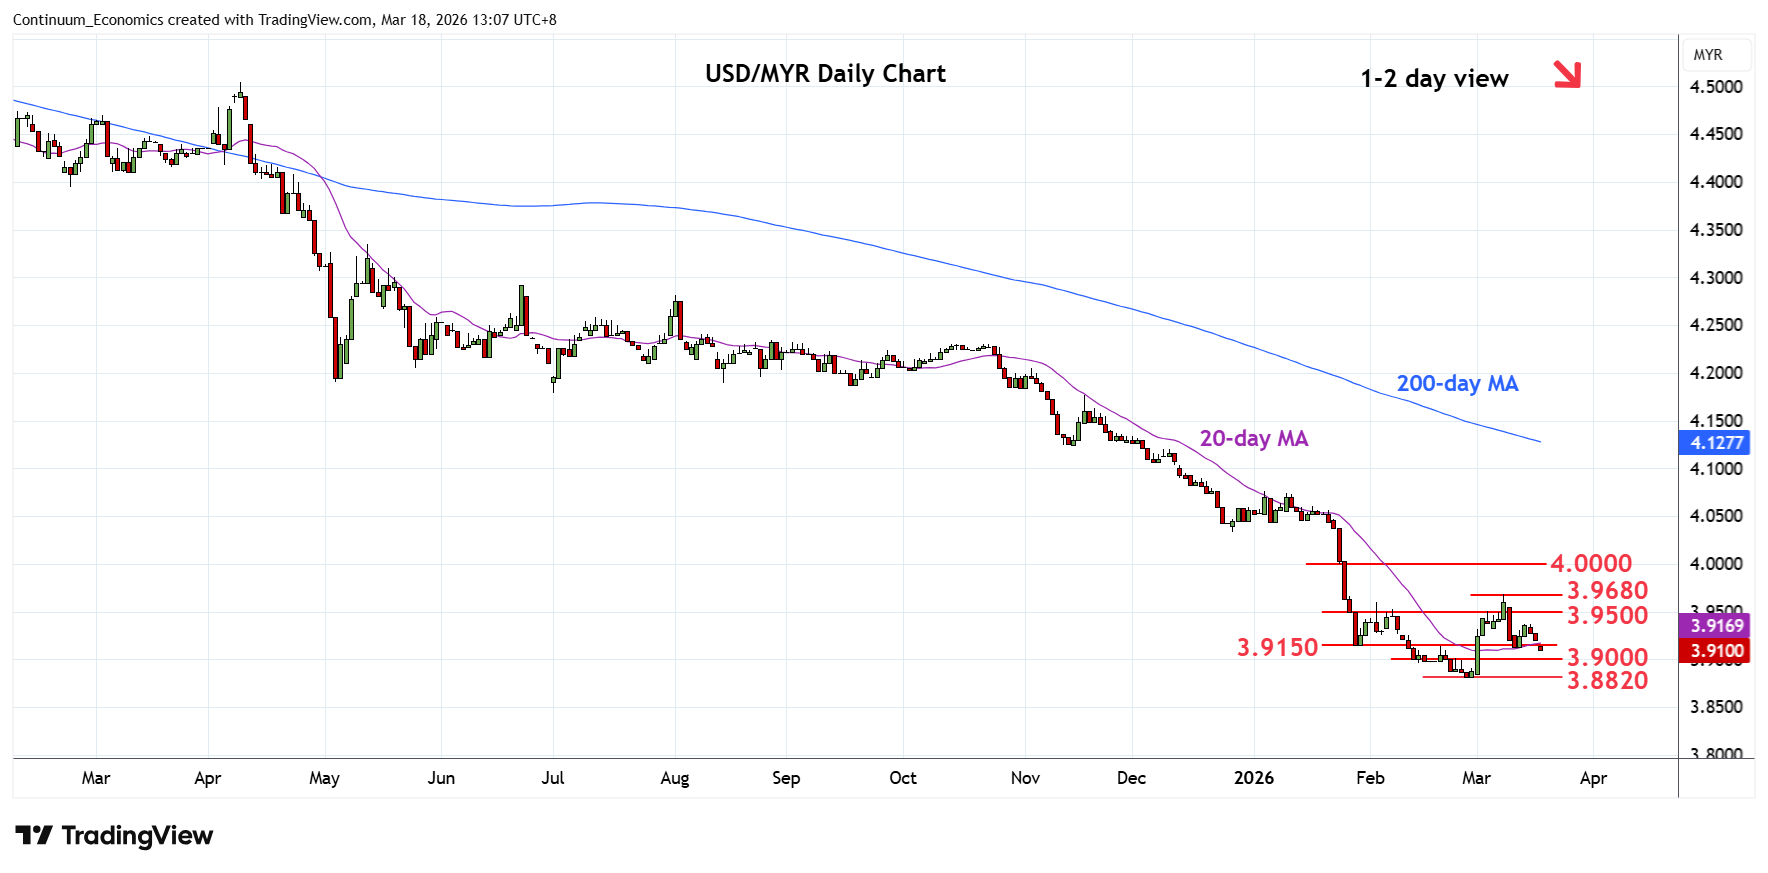
nder pressure as prices extend rejection from the 3.9680 high as daily studies unwind overbought readings
| Levels | Imp | Comment | Levels | Imp | Comment | |||
|---|---|---|---|---|---|---|---|---|
| R4 | 4.0330 | * | Dec low | S1 | 3.9000 | figure | ||
| R3 | 4.0000 | ** | figure, congestion | S2 | 3.8820 | ** | 26 Feb YTD low | |
| R2 | 3.9680 | ** | 9 Mar high | S3 | 3.8700 | * | Jan 2018 low | |
| R1 | 3.9500 | * | congestion | S4 | 3.8560 | ** | Apr 2018 year low |
Asterisk denotes strength of level
05:10 GMT - Under pressure as prices extend rejection from the 3.9680 high as daily studies unwind overbought readings and retrace gains from the 3.8820 February current year low. Break of the 3.9150 January low return focus to the downside and see scope to retest the 3.9000 level and 3.8820 low and see room to extend losses from the 2024 year high. Meanwhile, resistance at the 3.9500/3.9680 area are expected to cap. Would take break here to open up room for stronger corrective gains to retrace losses from the 4.5165, January 2025 year high.