Published: 2026-02-06T02:55:20.000Z
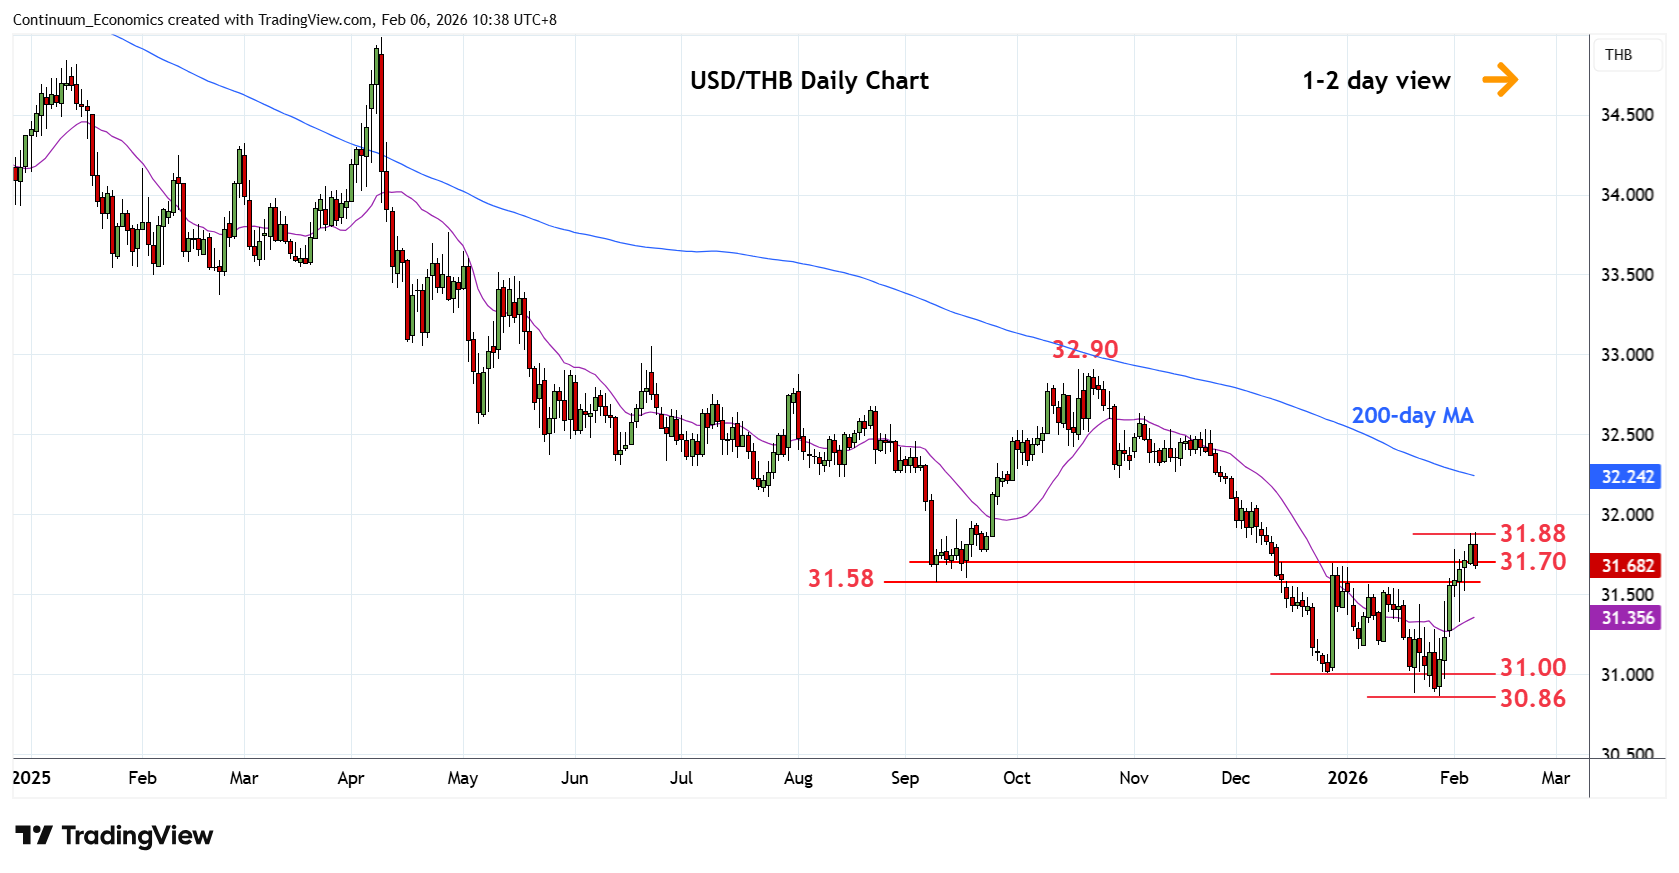
Chart USD/THB Update: Settled back from 31.88, Fibonacci level
-
Break above resistance at the 31.58/31.70 area saw gains reaching fresh high at 31.88, 50% Fibonacci level
| Level | Comment | Level | Comment | |||||
|---|---|---|---|---|---|---|---|---|
| R4 | 32.40 | * | congestion | S1 | 31.58 | * | Sep low | |
| R3 | 32.23 | ** | Oct low | S2 | 31.40 | * | congestion | |
| R2 | 32.10/12 | * | Jul low, 61.8% | S3 | 31.16 | * | 6 Jan low | |
| R1 | 31.88 | * | 50% Oct/Jan fall | S4 | 31.00 | ** | Dec low |
Asterisk denotes strength of level
02:45 GMT - Break above resistance at the 31.58/31.70 area saw gains reaching fresh high at 31.88, 50% Fibonacci level. Prices has since settled back in consolidation to unwind overbought intraday studies. Daily studies are stretched as well and suggest scope for pullback to retrace gains from the 30.86 January current year low. Meanwhile, support is raised to the September low at 31.58 which should now underpin. Would take break here to open up room for pullback to the 31.40/16 support. Below these will return focus to the 31.00 and 30.86 lows.