Published: 2026-04-06T04:31:17.000Z
Chart USD/MYR Update: Extend consolidation beneath 4.0500
-
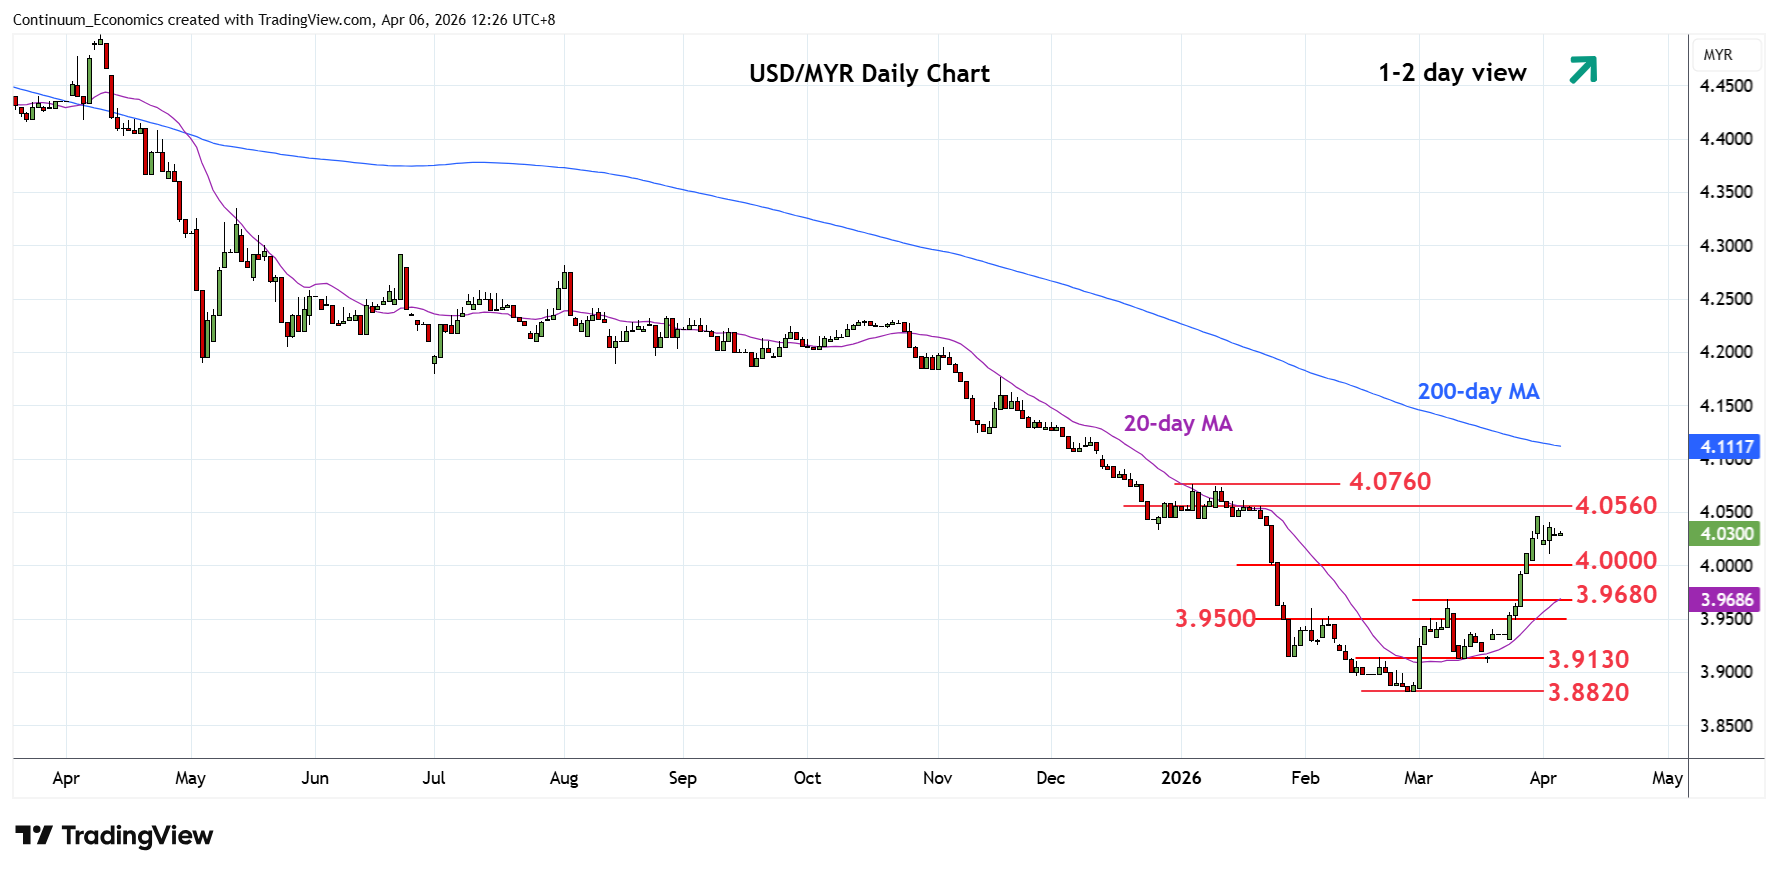
Little change, as prices extend consolidation beneath the 4.0500 congestion
| Levels | Imp | Comment | Levels | Imp | Comment | |||
|---|---|---|---|---|---|---|---|---|
| R4 | 4.1000 | ** | 2024 year low | S1 | 4.0000 | * | congestion | |
| R3 | 4.0970 | * | 61.8% Oct/Feb fall | S2 | 3.9680 | ** | 9 Mar high | |
| R2 | 4.0760 | * | 5 Jan YTD high | S3 | 3.9500 | * | congestion | |
| R1 | 4.0500/60 | * | congestion, 50% | S4 | 3.9300 | * | congestion |
Asterisk denotes strength of level
04:30 GMT - Little change, as prices extend consolidation beneath the 4.0500 congestion as prices unwind overbought intraday and daily studies. The resulting pennant pattern suggest scope for extension higher to retrace the October/February fall to 4.0560, 50% Fibonacci retracement. Higher will see scope to retest the 4.0760 January current year high and 4.0970, 61.8% Fibonacci level. Meanwhile, support is raised to the 4.0000 figure which should now underpin. Below here will see room for pullback to strong support at 3.9680/3.9500, 9 March high and congestion area.