Published: 2026-05-07T05:28:52.000Z
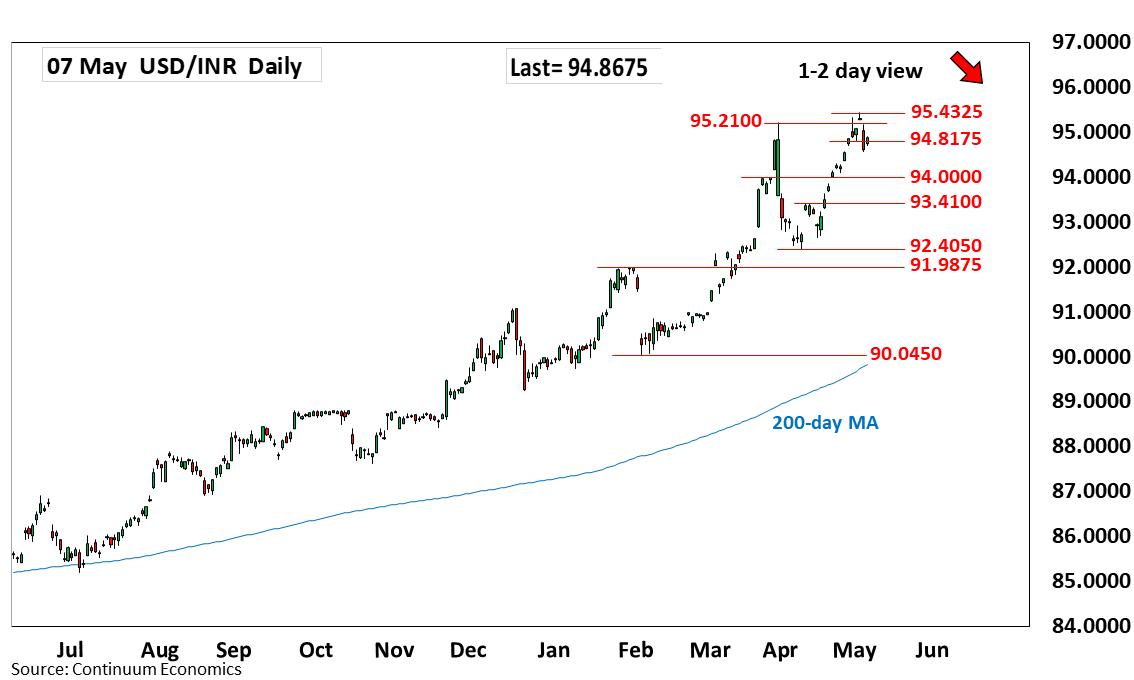
Chart USD/INR Update: Extending pullback from 95.4325 historic high
1
Turned up from the 94.5600 low as prices consolidate sharp drop from the 95.4325 all-time high
| Level | Comment | Level | Comment | |||||
|---|---|---|---|---|---|---|---|---|
| R4 | 96.0000 | figure | S1 | 94.5600 | * | 6 May low | ||
| R3 | 95.5000 | projection | S2 | 94.3050 | * | 24 Apr high | ||
| R2 | 95.4325 | ** | 5 May all-time high | S3 | 94.0000 | ** | figure, congestion | |
| R1 | 95.2100 | * | Mar high | S4 | 93.4100 | ** | 15 Apr high |
Asterisk denotes strength of level
05:20 GMT - Turned up from the 94.5600 low as prices consolidate sharp drop from the 95.4325 all-time high. Consolidation is expected to give way to renewed selling pressure later and see deeper pullback to retrace gains from the 92.4050 April low. Lower will see room to support at 94.3050 high of 24 April and the 94.0000 figure. Break here will see room to extend losses to strong support at 93.4100, 15 April high. Meanwhile, resistance at the 95.2100 and 95.4325, March and 5 May highs, now expected to cap.