Published: 2026-04-02T03:04:38.000Z
Chart USD/THB Update: Limited pullback from 33.00/05 highs
-
Consolidation below the 33.00/05 resistance and current year high has seen pullback limited to support at the 32.50/35 congestion area
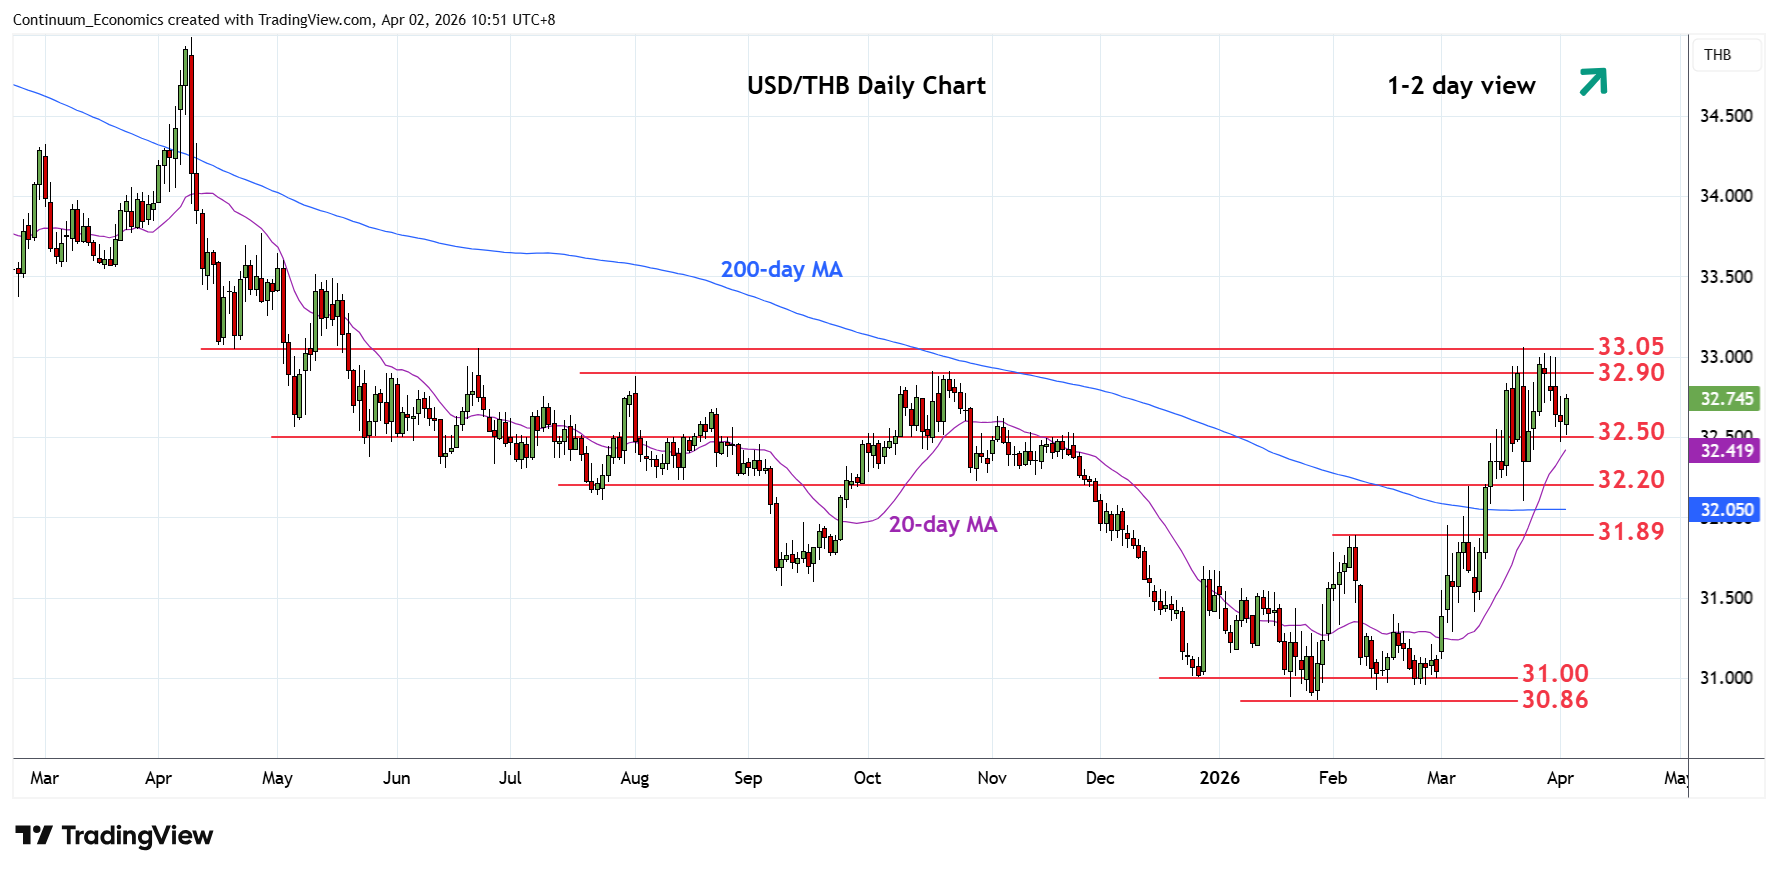
| Level | Comment | Level | Comment | |||||
|---|---|---|---|---|---|---|---|---|
| R4 | 33.50 | * | congestion | S1 | 32.50/35 | * | congestion | |
| R3 | 33.42 | * | 61.8% 2025/Jan fall | S2 | 32.20 | * | congestion | |
| R2 | 33.20 | * | congestion | S3 | 32.10 | * | 23 Mar low | |
| R1 | 33.00/05 | ** | figure, 23 Mar YTD high | S4 | 31.89 | ** | Feb high |
Asterisk denotes strength of level
02:50 GMT - Consolidation below the 33.00/05 resistance and current year high has seen pullback limited to support at the 32.50/35 congestion area. Bounce opens up room for retest of the 33.00 level but mixed daily studies suggest this should cap on retest. A later break here will further retrace losses from the March 2025 year high and see room to 33.42, 61.8% Fibonacci retracement. Meanwhile, support at the 32.50/35 congestion are should underpin. Break here will open up room for deeper pullback to support at 32.20/10 area and 31.89, February high.