Published: 2026-04-10T05:46:43.000Z
Chart USD/INR Update: Consolidating at 92.4150 low
1
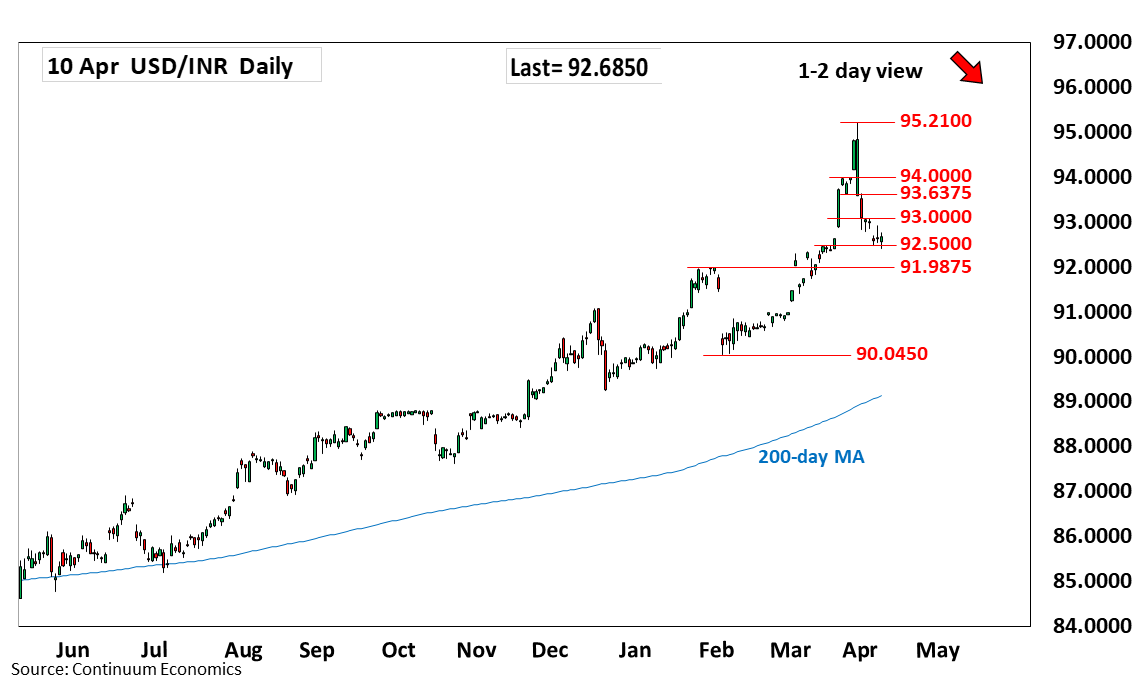
Break to fresh low has seen extension to 92.4150 low before turning up to unwind oversold intraday studies
| Level | Comment | Level | Comment | |||||
|---|---|---|---|---|---|---|---|---|
| R4 | 94.8400 | * | 27 Mar high | S1 | 92.4150 | intraday low | ||
| R3 | 93.9800 | * | 23 Mar high | S2 | 91.9875 | ** | Jan high | |
| R2 | 93.6375 | ** | 24 Mar low | S3 | 91.7350 | 10 Mar low | ||
| R1 | 93.0850 | * | 6 Apr high | S4 | 91.4025 | * | 5 Mar low |
Asterisk denotes strength of level
05:40 GMT - Break to fresh low has seen extension to 92.4150 low before turning up to unwind oversold intraday studies. Daily studies are stretched as well but consolidation expected to give way to further losses later. Lower will see further retracement of strong gains from the 90.0450 February low and see room to critical support at 91.9875, January high. Meanwhile, resistance is lowered to the 93.0000/93.0850 congestion area which is expected to cap. Break here, will open up room for stronger bounce to resistance at the 93.6375/94.0000 area.