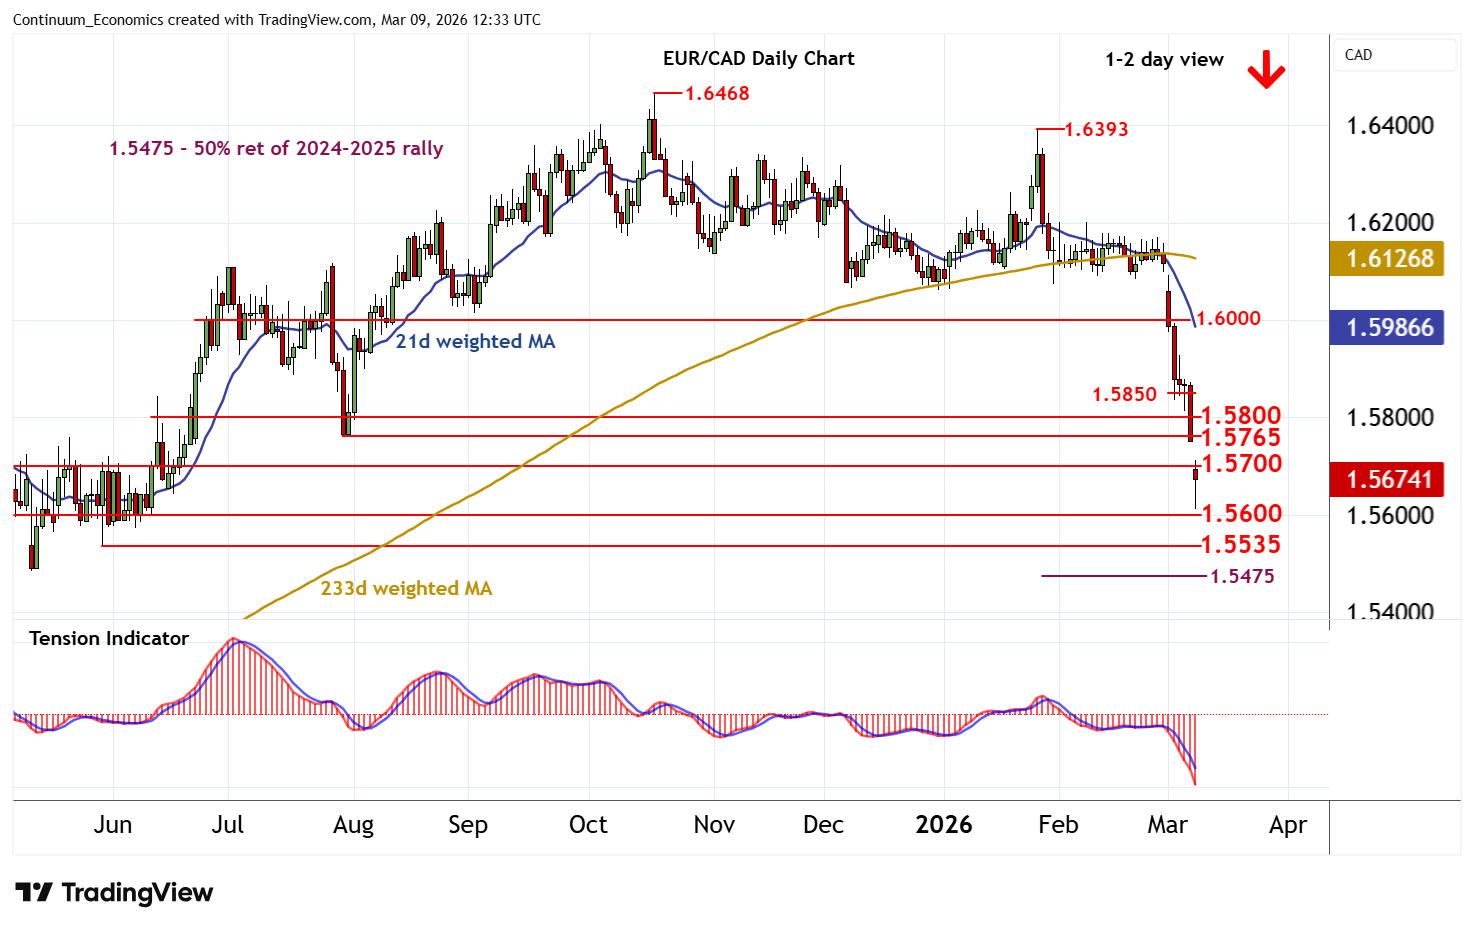
Chart EUR/CAD Update: Gapped lower to fresh 2026 year low
Anticipated losses have gapped lower to post a fresh 2026 year low around 1.5615
| Level | Comment | Level | Comment | |||||
|---|---|---|---|---|---|---|---|---|
| R4 | 1.5850 | minor congestion | S1 | 1.5615~ | fresh 2026 YTD low | |||
| R3 | 1.5800 | minor congestion | S2 | 1.5600 | * | congestion | ||
| R2 | 1.5750/65 | * | 6 Mar gap high; 30 July (m) low | S3 | 1.5535 | * | 29 May 25 (w) low | |
| R1 | 1.5700/13 | ** | congestion; gap low | S4 | 1.5475 | ** | 50% ret of 2024-2025 rally |
Asterisk denotes strength
12:10 GMT - Anticipated losses have gapped lower to post a fresh 2026 year low around 1.5615, where unwinding oversold intraday studies are prompting a bounce back to resistance at congestion around 1.5700 and the 1.5713 gap low. Daily stochastics are flat in oversold areas, suggesting potential for consolidation around here, before the bearish daily Tension Indicator and negative weekly and longer-term charts prompt further losses. A break below congestion around 1.5600 will add weight to already bearish sentiment and extend October losses towards the 1.5535 weekly low of 29 May 2025. Beneath here is the 1.5475 Fibonacci retracement, where short-covering/consolidation could appear. Meanwhile, a break above 1.5700/13, if seen, should meet renewed selling interest towards 1.5750/65.