Published: 2025-12-10T05:30:52.000Z
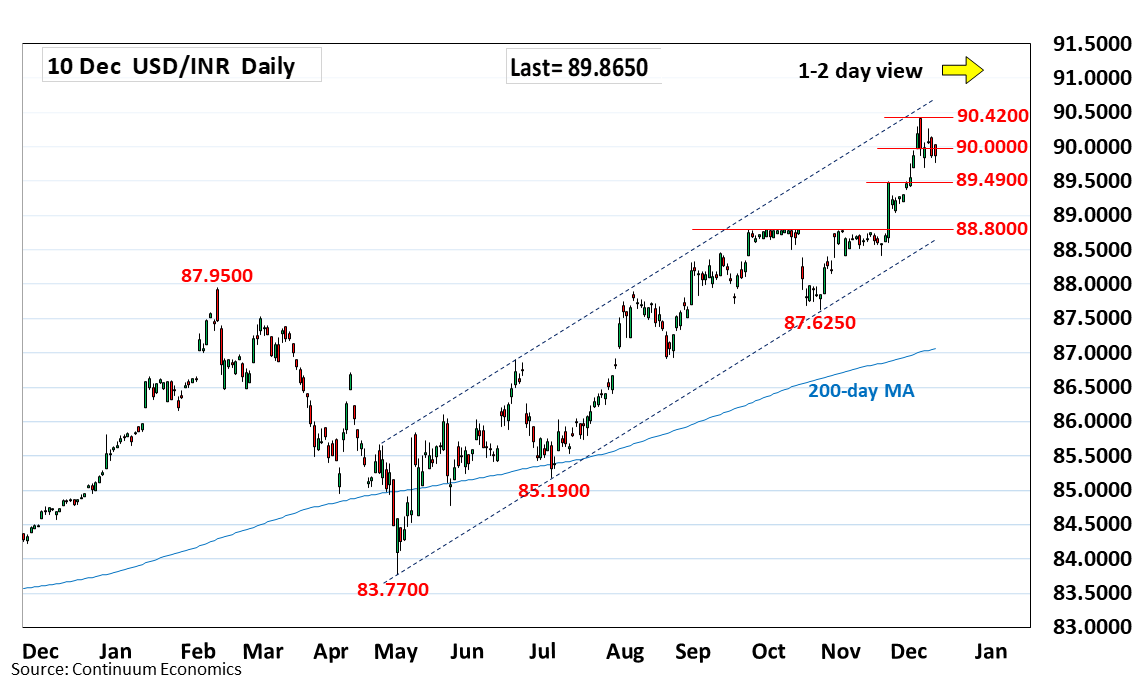
Chart USD/INR Update: Extending consolidation below 90.4200 high
-
Extending consolidation below the 90.4200 record high as prices unwind overbought daily studies
| Level | Comment | Level | Comment | |||||
|---|---|---|---|---|---|---|---|---|
| R4 | 91.0000 | * | figure | S1 | 89.6950 | * | 5 Dec low | |
| R3 | 90.7500 | * | projection | S2 | 89.4900 | ** | Nov high | |
| R2 | 90.5000 | * | congestion | S3 | 89.0000 | * | figure | |
| R1 | 90.4200 | ** | 4 Dec all-time high | S4 | 88.8000 | ** | Sep high |
Asterisk denotes strength of level
05:25 GMT - Extending consolidation below the 90.4200 record high as prices unwind overbought daily studies. However, bullish structure keeps focus on the upside to extend the underlying bull trend. Higher will target congestion at the 90.5000/90.7500 area then the 91.0000 figure. Meanwhile, support is at the 89.6950 Friday's higher low which is expected to underpin and limit corrective pullback. Would take break here will ease the upside pressure and open up room for deeper pullback to strong support at 89.4900, November high.