Published: 2026-03-16T02:32:24.000Z
Chart USD/SGD Update: Strong resistance at 1.2850/55
10
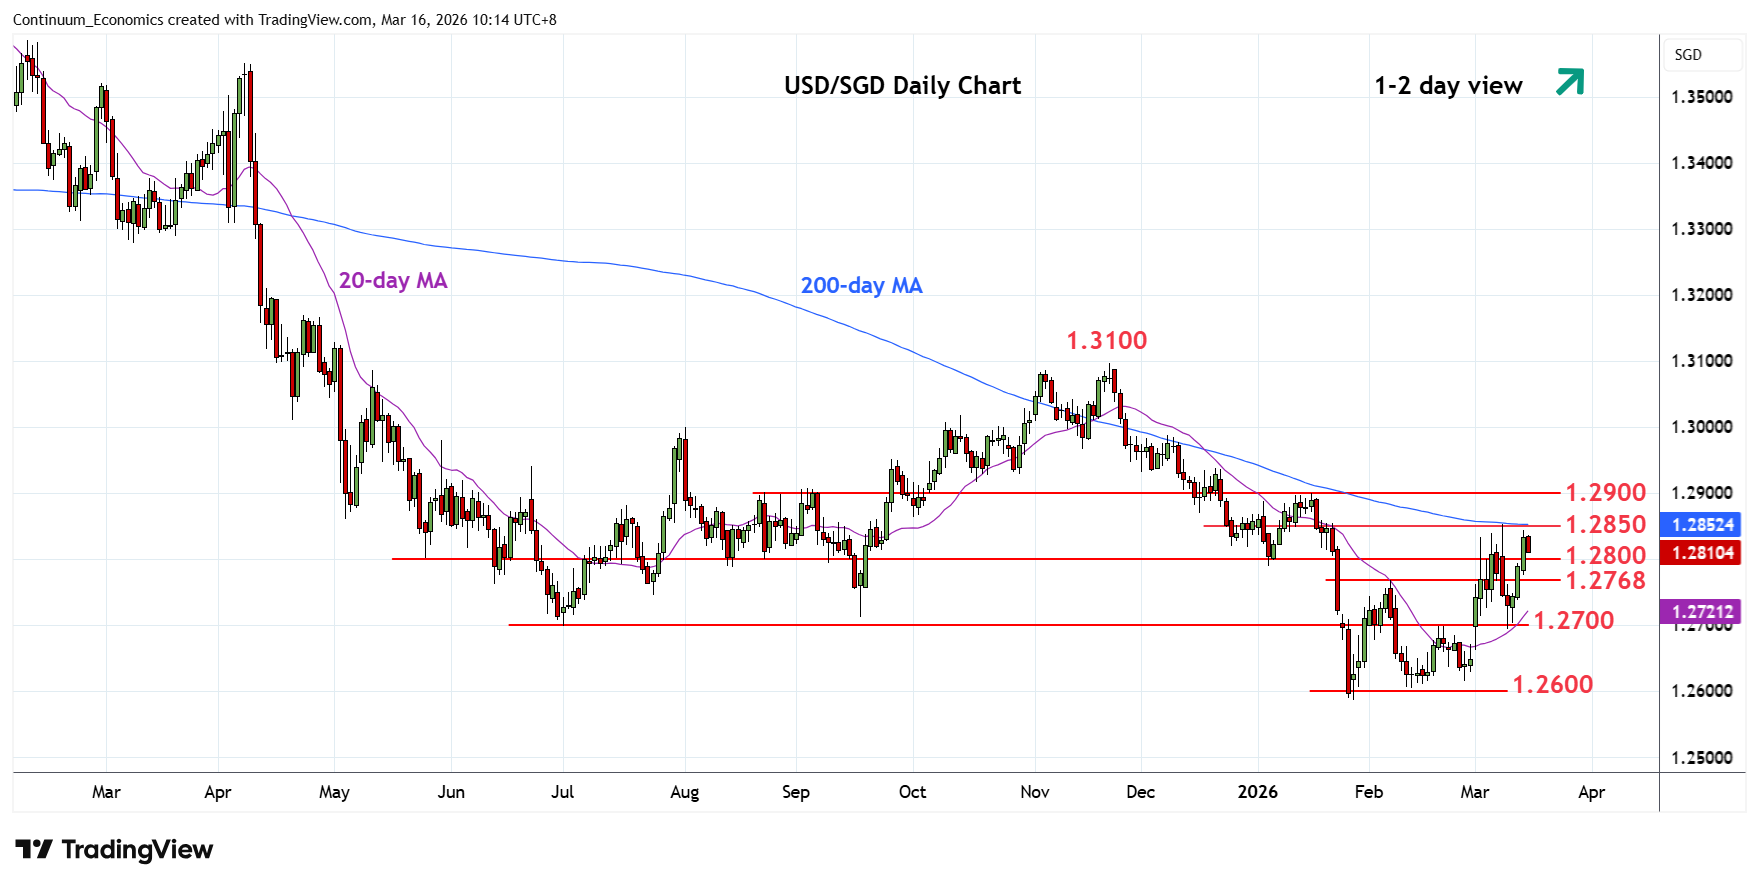
Settled back in consolidation beneath strong resistance at the 1.2850/55 congestion and 200-day MA
| Level | Comment | Level | Comment | ||||
|---|---|---|---|---|---|---|---|
| R4 | 1.2950 | * | congestion | S1 | 1.2800 | * | congestion |
| R3 | 1.2938 | * | 19 Dec high | S2 | 1.2768 | ** | Feb high |
| R2 | 1.2900 | ** | 16 Jan YTD high, 61.8% | S3 | 1.2700 | ** | 19 Feb high, congestion |
| R1 | 1.2850/55 | ** | congestion, 200-day MA | S4 | 1.2650 | * | congestion |
Asterisk denotes strength of level
02:25 GMT - Settled back in consolidation beneath strong resistance at the 1.2850/55 congestion and 200-day MA. Prices are unwinding overbought intraday studies but this is expected to give way to renewed buying interest later. Clearance will expose the 1.2900 January current year high and 61.8% Fibonacci level to retest. Meanwhile, support is raised to the 1.2800 congestion which extend to the 1.2768, 6 February high, which should now underpin. Break here will fade the upside pressure and see room for pullback to retest 1.2700 support.