Published: 2026-03-06T04:12:46.000Z
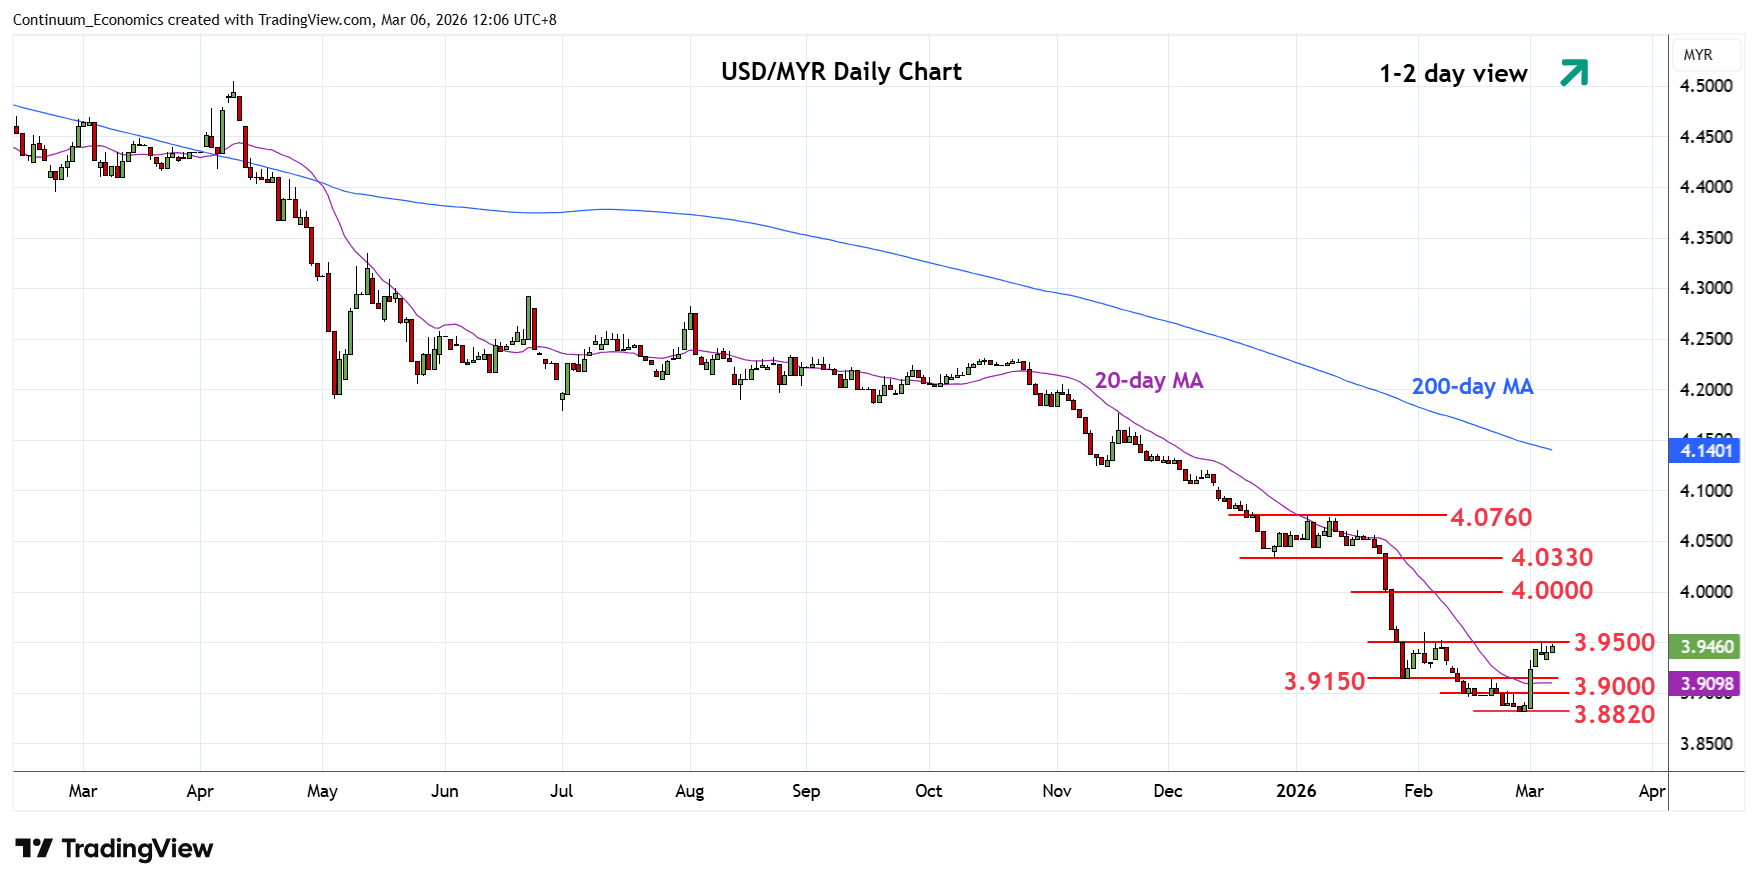
Chart USD/MYR Update: Consolidating below 3.9500
1
Keeping below resistance at the 3.9500 level as prices consolidate gains from the 3.8820, February current year low
| Levels | Imp | Comment | Levels | Imp | Comment | |||
|---|---|---|---|---|---|---|---|---|
| R4 | 4.0500 | * | congestion | S1 | 3.9150 | * | Jan low | |
| R3 | 4.0330 | * | Dec low | S2 | 3.8820 | ** | 26 Feb YTD low | |
| R2 | 4.0000 | ** | figure, 2021 year low | S3 | 3.8700 | * | Jan 2018 low | |
| R1 | 3.9500 | * | congestion | S4 | 3.8560 | ** | Apr 2018 year low |
Asterisk denotes strength of level
04:10 GMT - Keeping below resistance at the 3.9500 level as prices consolidate gains from the 3.8820, February current year low. The daily and week studies are unwinding oversold readings and suggest scope for break to see stronger gains to retrace losses from the 4.5165, January 2025 year high. Clearance will see room to the strong resistance at 4.0000, figure and the 2021 year low. Meanwhile, support remains at the 3.9150 January low and congestion area which should now underpin and sustain bounce from the 3.8820, 26 February current year low.