Published: 2025-12-11T03:15:43.000Z
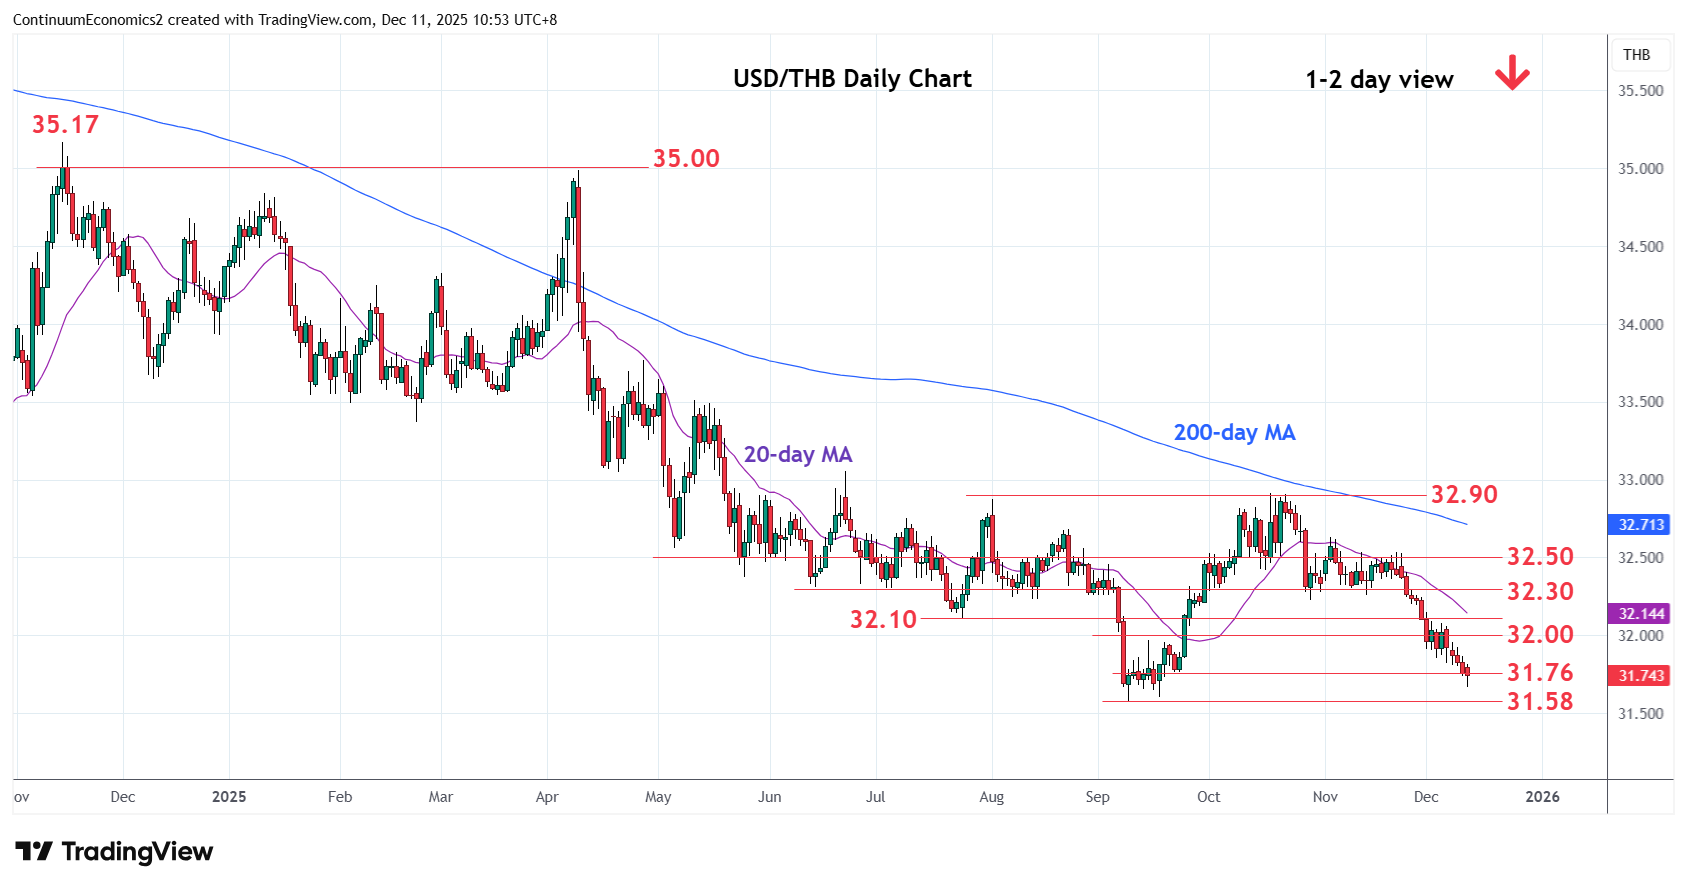
Chart USD/THB Update: Within reach of 31.58, September YTD low
-
Pressure stays firmly on the downside from the 32.90 October high and see scope to retest the 31.58, September current year low
| Level | Comment | Level | Comment | |||||
|---|---|---|---|---|---|---|---|---|
| R4 | 32.50 | * | congestion | S1 | 31.76 | * | 22 Sep low | |
| R3 | 32.30 | ** | congestion | S2 | 31.58 | ** | 9 Sep YTD low | |
| R2 | 32.10 | ** | Jul low | S3 | 31.50 | * | congestion | |
| R1 | 32.00 | * | congestion | S4 | 31.30 | congestion |
Asterisk denotes strength of level
03:00 GMT - Pressure stays firmly on the downside from the 32.90 October high and break of support at 31.76 will see room for extension to retest the 31.58, September current year low. Oversold daily and weekly studies suggest reaction at the latter likely but a later break cannot be ruled out. Lower will see extension of the broader losses from the 2022 year high and see room to support at 31.50/31.30 congestion area. Meanwhile, resistance at the 32.00/32.10 congestion and July low is expected to cap and sustain losses from October high.