Chartbook: Chart USD Index DXY: Extending 2022 losses
Anticipated losses have posted a close below 100.00 and reached the 98.00 multi-year Fibonacci retracement
Anticipated losses have posted a close below 100.00 and reached the 98.00 multi-year Fibonacci retracement,
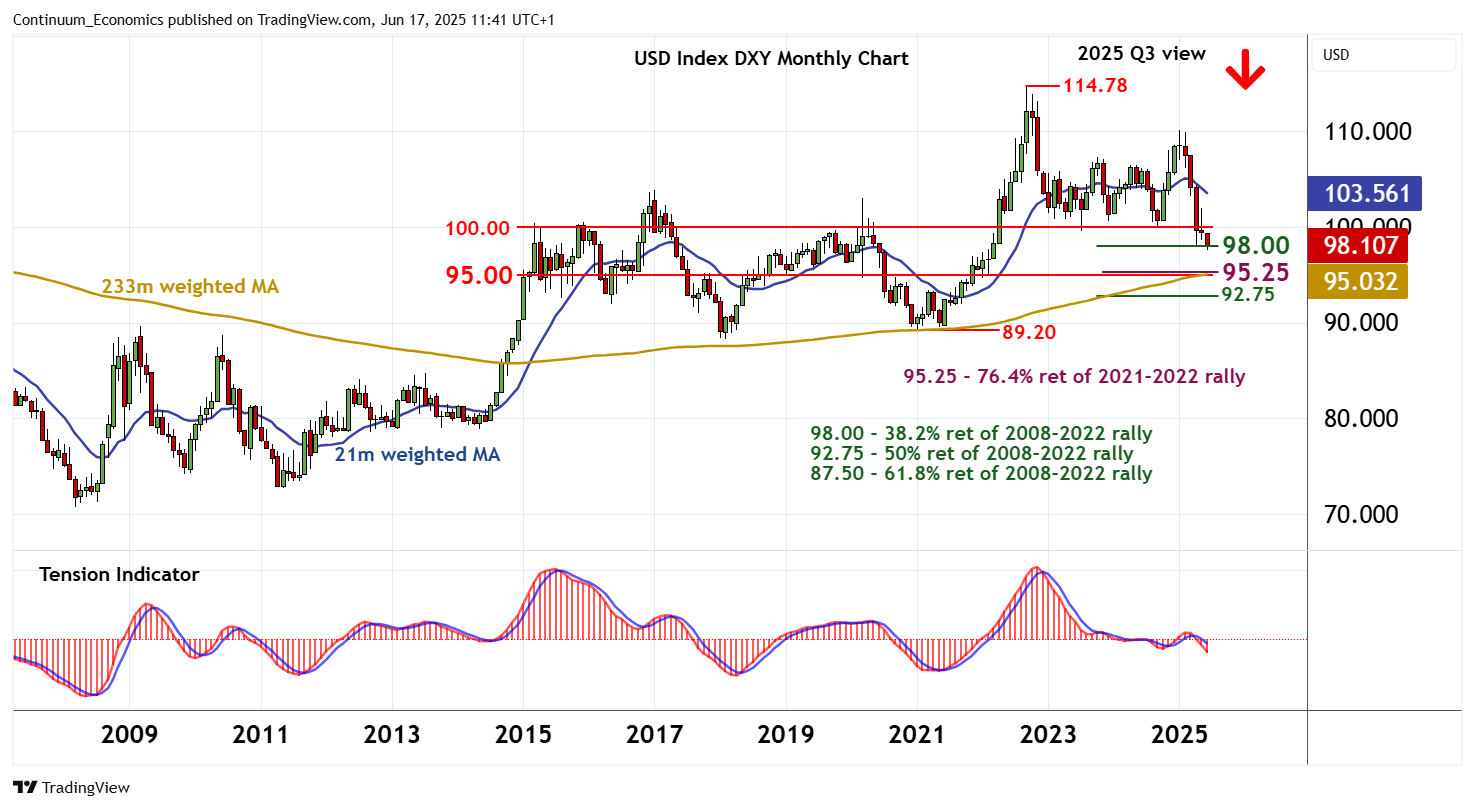
where oversold short-term studies are prompting consolidation.
Monthly stochastics are falling and the monthly Tension Indicator is also under pressure, highlighting completion of the 2023-2025 distribution top above 100.00 and room for further losses in the coming weeks/months.
A close below 99.00 will add further weight to sentiment and extend the fall from the 114.78 multi-year high of September 2022, with next significant support at congestion around 95.00 and the 95.25 multi-month Fibonacci retracement. Bearish longer-term readings point to potential for extension towards the 92.75 retracement.
Meanwhile, resistance is at the 100.00 base of the multi-month distribution top.
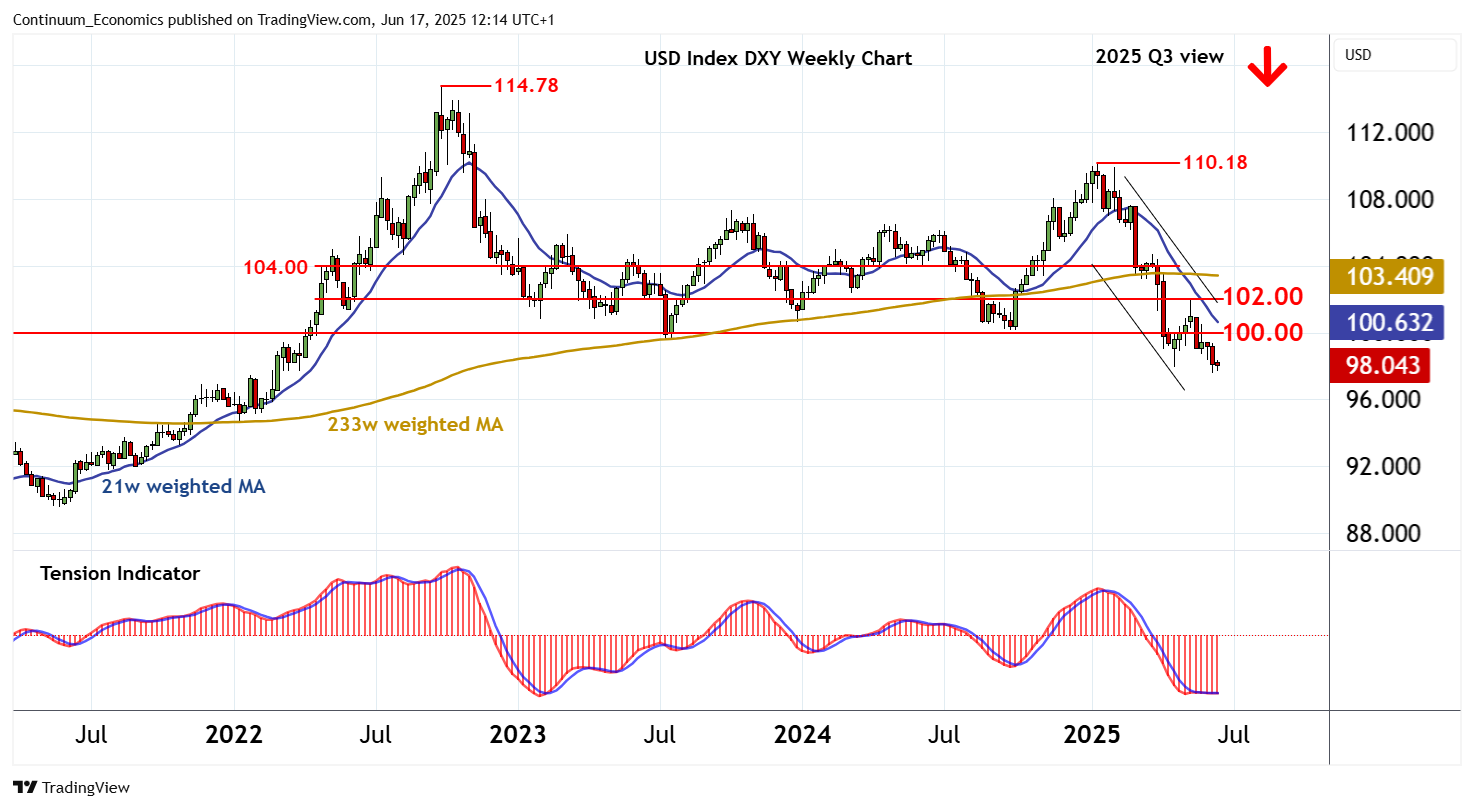
A close above here, if seen, would delay lower levels and give way to consolidation beneath the 102.00 break level.
An unexpected close above here would signal a more significant corrective bounce within the 2025 bear trend, and open up 104.00, where fresh selling interest is expected to appear.