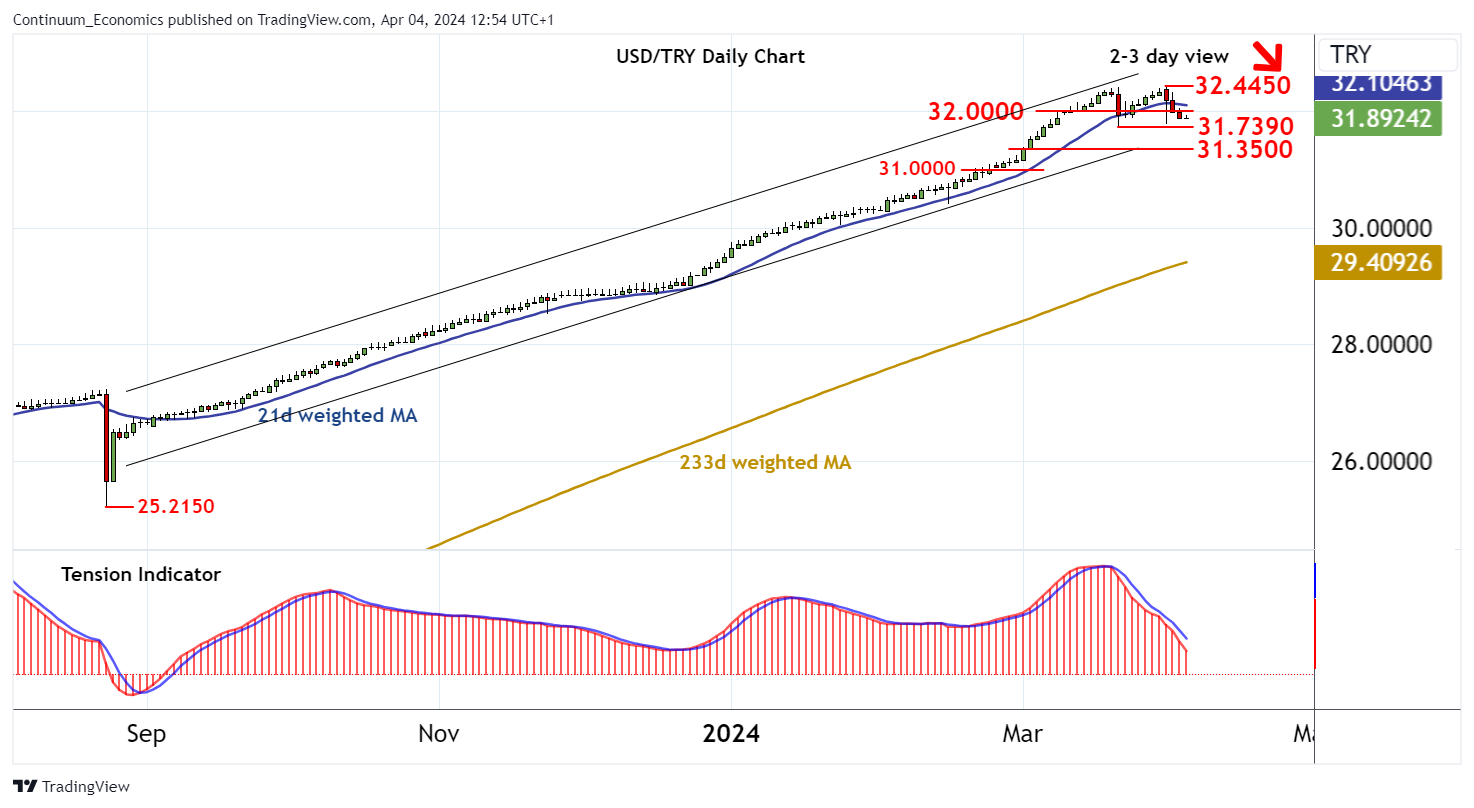
Chart USD/TRY Update: Under pressure
Cautious trade has given way to a fresh high at 32.4450, where negative daily readings are prompting profit-taking and a pullback

| Levels | Imp | Comment | Levels | Imp | Comment | |||
| R4 | 34.0000 | * | figure | S1 | 31.7390 | * | 21 Mar (w) low | |
| R3 | 33.0000 | * | figure | S2 | 31.3500 | * | 1-4 Mar break level | |
| R2 | 32.4450 | ** | 1 Apr all time high | S3 | 31.0000 | * | figure | |
| R1 | 32.0000 | * | congestion | S4 | 30.2965 | 2 Feb (m) low |
Asterisk denotes strength of level
12:35 BST - Cautious trade has given way to a fresh high at 32.4450, where negative daily readings are prompting profit-taking and a pullback. Immediate focus is on strong support at the 31.7390 weekly low of 21 March, where already oversold daily stochastics could prompt fresh reactions. However, the daily Tension Indicator is bearish and broader weekly charts are turning mixed/negative, highlighting a deterioration in sentiment and potential for deeper losses in the coming sessions. A close beneath here will turn sentiment outright negative and confirm a near-term top in place at 32.4450, as focus then turns to 31.3500. Meanwhile, a close above 32.4450, if seen, will turn sentiment positive once again and confirm continuation of the underlying bull trend.