Published: 2026-04-09T05:22:32.000Z
Chart USD/INR Update: Consolidating at 92.4700 low
1
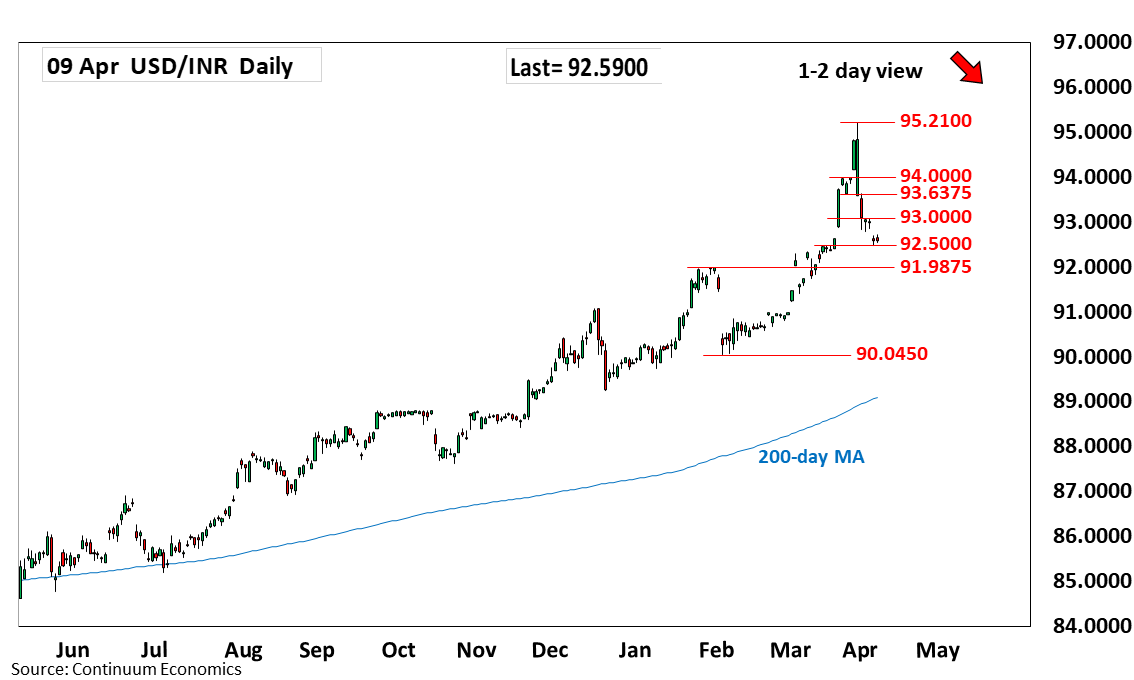
Steadied at the 92.4700 low as prices consolidate sharp losses from the 95.2100 all-time high
| Level | Comment | Level | Comment | |||||
|---|---|---|---|---|---|---|---|---|
| R4 | 94.8400 | * | 27 Mar high | S1 | 92.4700 | * | 8 Apr low | |
| R3 | 93.9800 | * | 23 Mar high | S2 | 91.9875 | ** | Jan high | |
| R2 | 93.6375 | ** | 24 Mar low | S3 | 91.7350 | 10 Mar low | ||
| R1 | 93.0850 | * | 6 Apr high | S4 | 91.4025 | * | 5 Mar low |
Asterisk denotes strength of level
05:20 GMT - Steadied at the 92.4700 low as prices consolidate sharp losses from the 95.2100 all-time high. Consolidation here see prices unwinding the stretched intraday and daily studies but negative weekly studies highlight risk for further losses going forward. Lower will further retrace strong gains from the 90.0450 February low and see room to critical support at 91.9875, January high. Meanwhile, resistance is lowered to the 93.0000/93.0850 congestion area which is expected to cap. Clearance will open up room for stronger bounce to resistance at the 93.6375/94.0000 area.