Published: 2025-12-04T06:04:31.000Z
Chart USD/IDR Updates: Extending pullback from 16760, November high
1
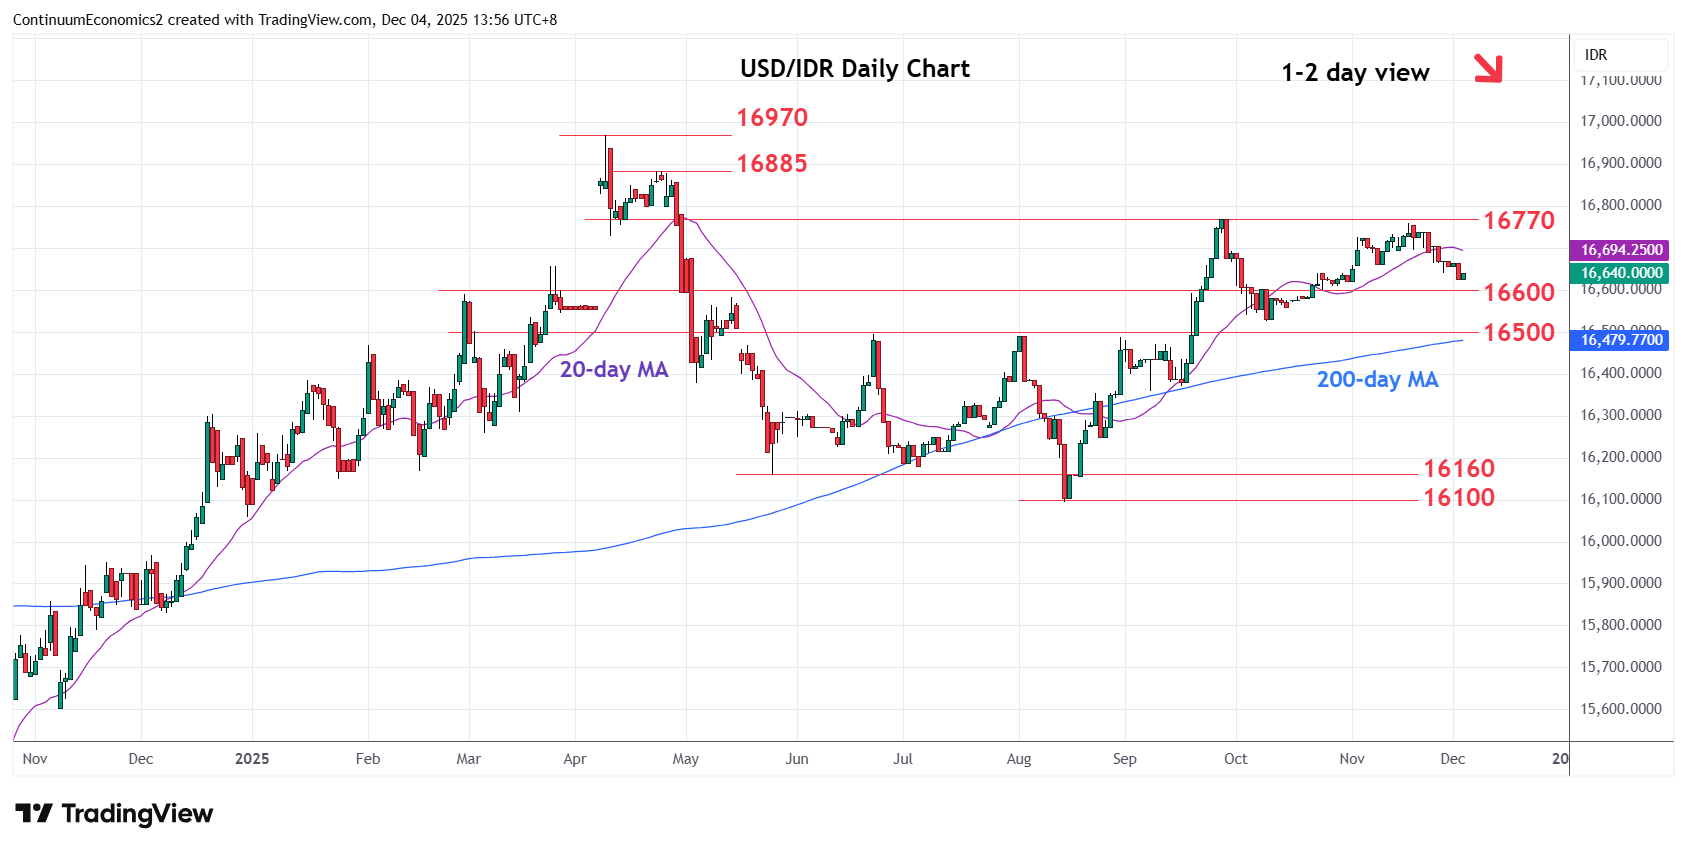
Extending pullback from the 16760 high as prices unwind overbought daily and weekly studies
| Levels | Imp | Comment | Levels | Imp | Comment | |||
|---|---|---|---|---|---|---|---|---|
| R4 | 16885 | * | 23 Apr high | S1 | 16600 | * | congestion | |
| R3 | 16800 | * | congestion | S2 | 16525 | * | Oct low | |
| R2 | 16770/60 | ** | Sep, 18 Nov highs | S3 | 16500 | ** | Jun high, congestion | |
| R1 | 16700 | * | congestion | S4 | 16400 | * | congestion |
Asterisk denotes strength of level
06:00 GMT - Extending pullback from the 16760 high as prices unwind overbought daily and weekly studies. Break of the 16640 support see room for deeper pullback to 16600 level. Break here will see room for extension to retest the strong support at 16525/16500, congestion and June high. Lower still, will see room for deeper pullback to retrace August/September rally to the 16400 congestion. Meanwhile, resistance remains at the 16700 congestion which is expected to cap and sustain losses from the 16760/16770, November/September highs.