Published: 2025-11-05T06:18:49.000Z
Chart USD/TWD Update: Extend July gains
1
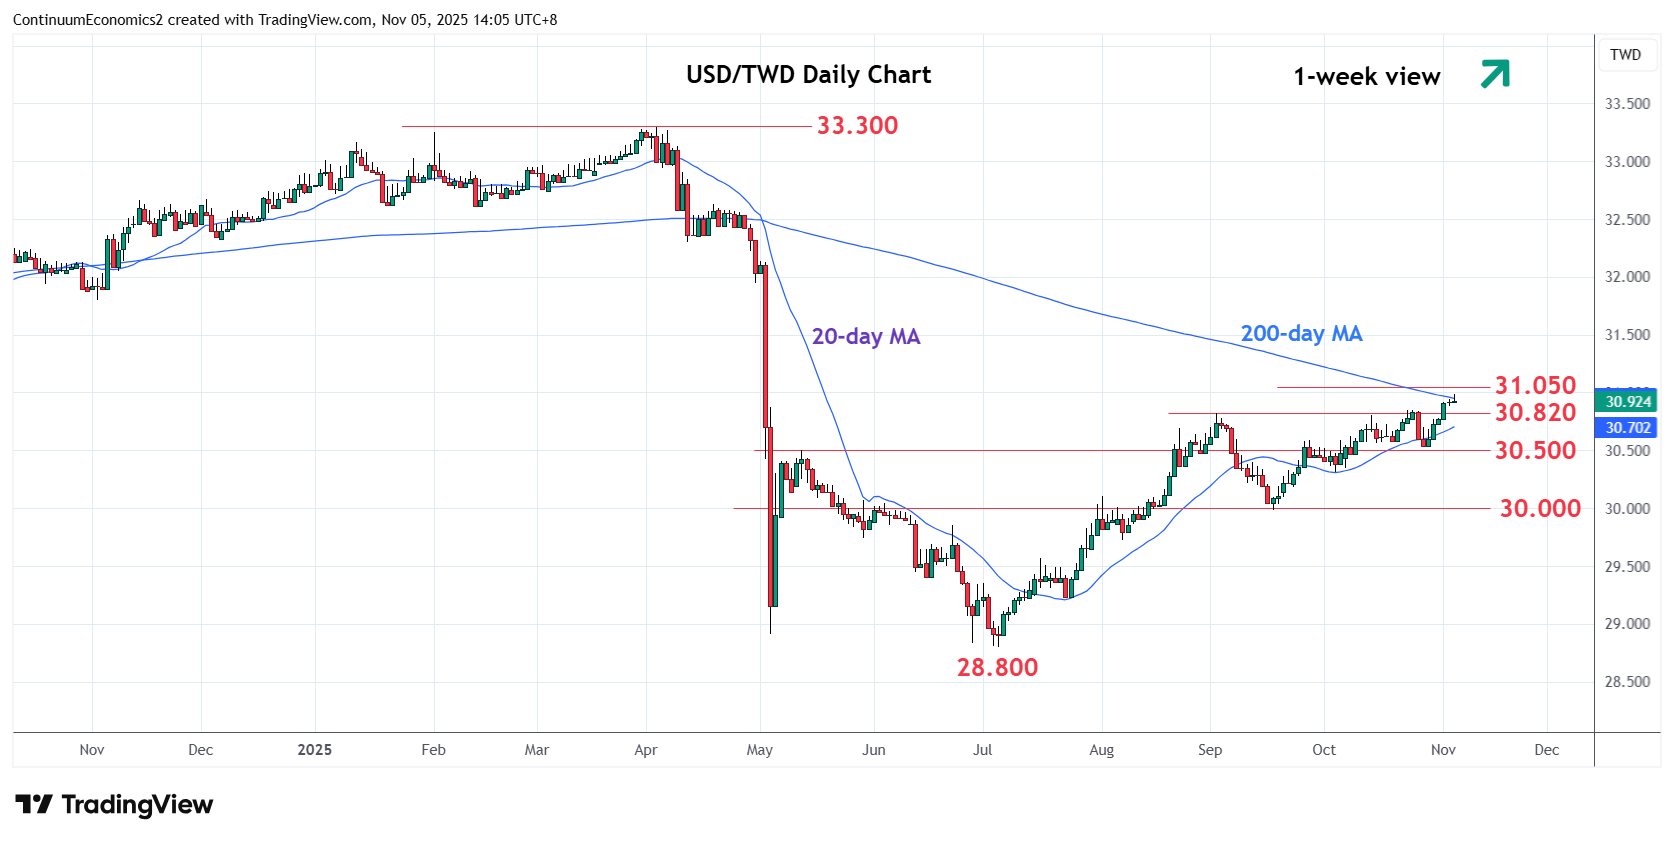
Break above resistance at the 30.820 September high see prices extending gains from the 28.800 July current year low to reach the 31.000 level
| Levels | Imp | Comment | Levels | Imp | Comment | |||
|---|---|---|---|---|---|---|---|---|
| R4 | 31.500 | * | congestion | S1 | 30.820 | * | Sep high | |
| R3 | 31.300 | * | congestion | S2 | 30.500 | * | congestion | |
| R2 | 31.200 | * | congestion | S3 | 30.310 | * | 3 Oct low | |
| R1 | 31.050 | * | 50% Apr/Jun fall | S4 | 30.000 | ** | Sep low |
06:20 GMT - Break above resistance at the 30.820 September high see prices extending gains from the 28.800 July current year low to reach the 31.000 level. Above here will see room for further gains to retrace the April/June losses to the 31.050, 50% Fibonacci level. Higher still, will see room to the 31.200/31.300 congestion area. Stretched daily and weekly studies caution corrective pullback with support raised to the 30.820 September high. Below this will room for deeper pullback to the 30.500/30.310 congestion and October low.