Published: 2025-11-26T06:48:00.000Z
Chart USD/IDR Updates: Under pressure
3
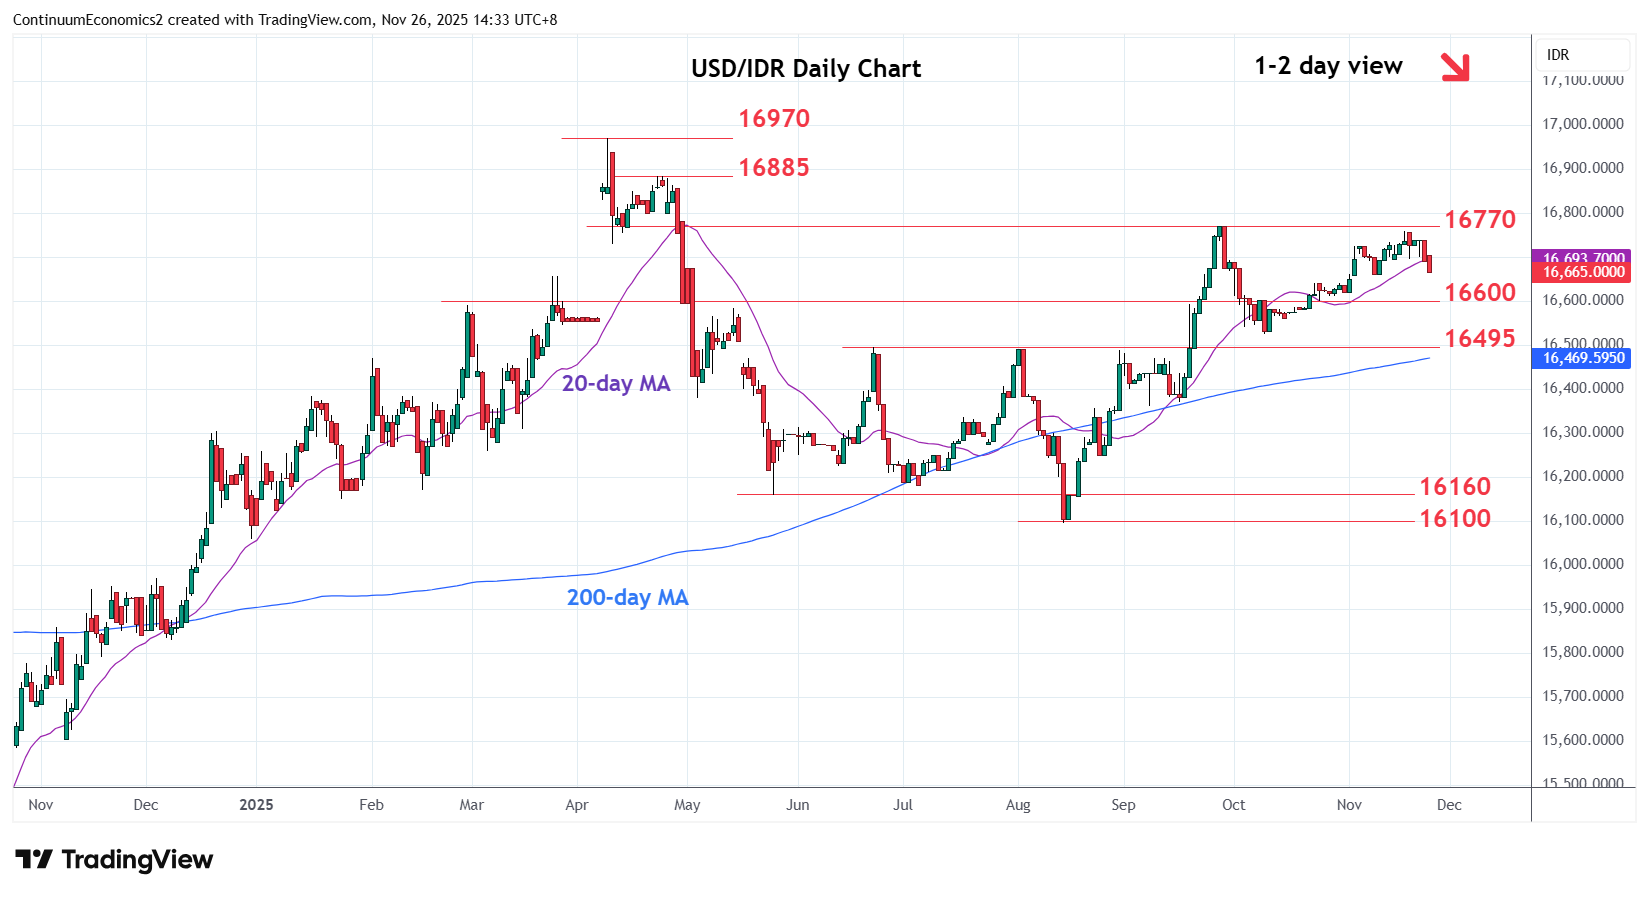
Extending pullback from the 16760/16770 highs
| Levels | Imp | Comment | Levels | Imp | Comment | |||
|---|---|---|---|---|---|---|---|---|
| R4 | 16885 | * | 23 Apr high | S1 | 16600 | * | congestion | |
| R3 | 16800 | * | congestion | S2 | 16525 | * | Oct low | |
| R2 | 16770 | ** | Sep high | S3 | 16500 | ** | Jun high, congestion | |
| R1 | 16700 | * | congestion | S4 | 16400 | * | congestion |
Asterisk denotes strength of level
06:40 GMT - Extending pullback from the 16760/16770 highs and break of the 16700/16660 area see room for deeper pullback to the 16600 congestion and 16525 October low. Negative daily studies and stretched weekly chart suggest room for pullback to support at the 16600 congestion then strong support at 16525/16500 congestion and June high. Break of this area will see room for deeper pullback to retrace August/September rally. Meanwhile, resistance is lowered to 16700 congestion which should cap and sustain losses from the 16760/16770 highs.