Published: 2026-03-10T03:01:25.000Z
Chart USD/THB Update: Reversing gains from the February low
1
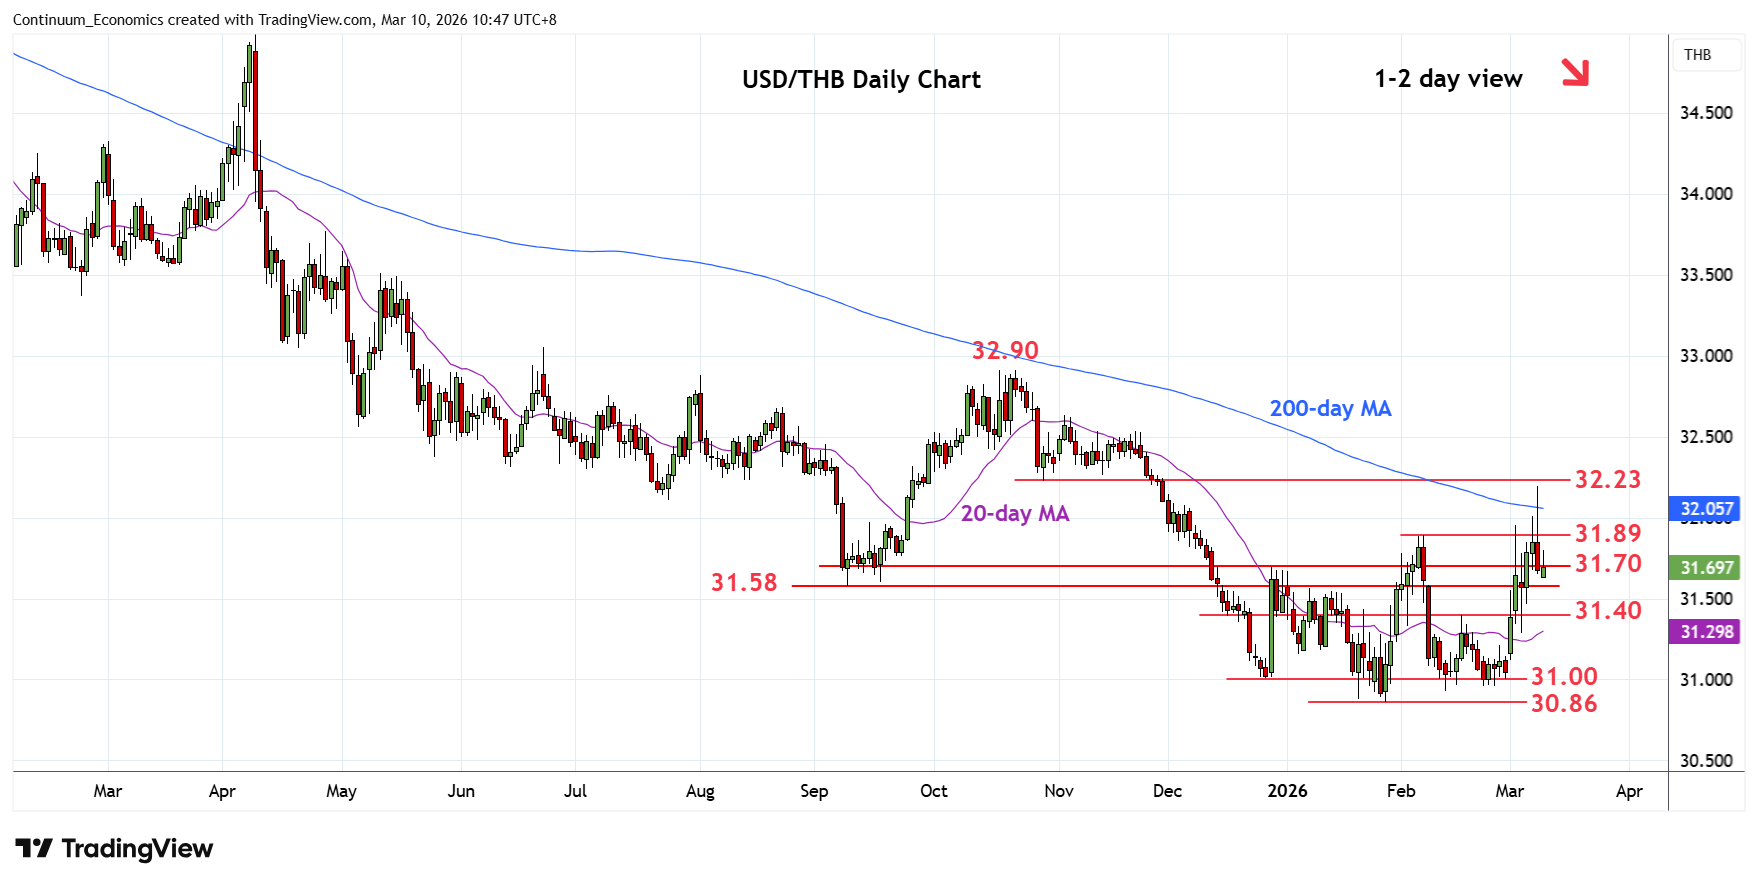
Break to fresh year high has met with selling pressure at the 32.20/23 resistance
| Level | Comment | Level | Comment | |||||
|---|---|---|---|---|---|---|---|---|
| R4 | 32.42 | * | 76.4% Oct/Jan fall | S1 | 31.60/58 | * | congestion, Sep low | |
| R3 | 32.20/23 | ** | congestion, Oct low | S2 | 31.40 | ** | 17 Feb high | |
| R2 | 32.00 | * | congestion | S3 | 31.20 | * | congestion | |
| R1 | 31.89 | ** | Feb high | S4 | 31.00 | ** | Dec low, congestion |
Asterisk denotes strength of level
02:50 GMT - Break to fresh year high has met with selling pressure at the 32.20/23 resistance as intraday and daily studies unwind overbought readings. The resulting wick at the 32.20 high suggest gains from the February low now being reversed towards support at the 31.60/58 area. Below here will open up room to strong support at 31.40. Would take break here to return focus to the downside for retest of the February and January lows. Meanwhile, resistance is at the 31.89 February high which is expected to cap and sustain rejection from the 32.20 high.