Published: 2026-01-14T05:24:33.000Z
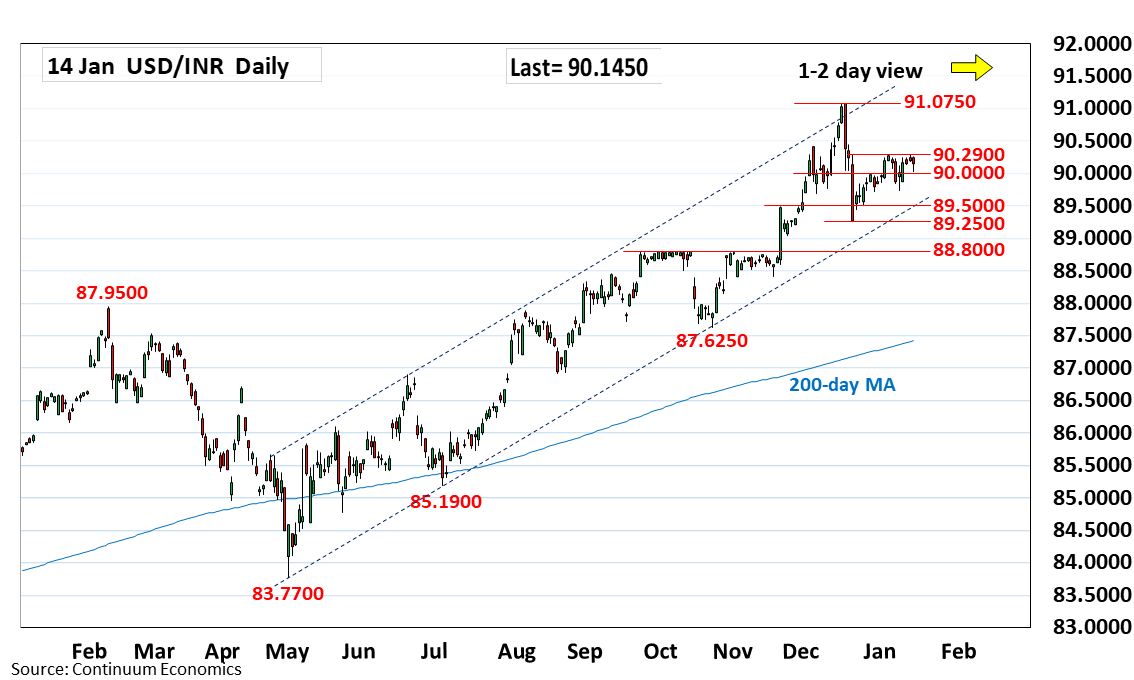
Chart USD/INR Update: Lower in consolidation from 90.2900 resistance
-
Settling back in consolidation from resistance at the 90.2900 high as prices unwind overbought intraday studies
| Level | Comment | Level | Comment | |||||
|---|---|---|---|---|---|---|---|---|
| R4 | 91.0750 | ** | Dec 2025 all-time high | S1 | 90.0000 | * | figure | |
| R3 | 90.5000 | * | congestion | S2 | 89.7200 | ** | 30 Dec low | |
| R2 | 90.4200 | * | 4 Dec high | S3 | 89.5000 | * | congestion | |
| R1 | 90.2900 | ** | 5 Jan high | S4 | 89.2500 | ** | Dec low |
Asterisk denotes strength of level
05:20 GMT - Settling back in consolidation from resistance at the 90.2900 high as prices unwind overbought intraday studies. Stretched daily studies suggest room for deeper pullback to retrace gains from the 89.2500, December low. Break of the 90.0000 figure will open up room for pullback then the 89.7200 low. Below the latter will return focus to the downside for retest of the 89.2500 December low and see room to extend losses from the 91.0750 all-time high. Meanwhile, resistance at at the 90.2900 high is expected to cap.