Published: 2026-03-10T04:59:41.000Z
Chart USD/INR Update: Lower in consolidation
3
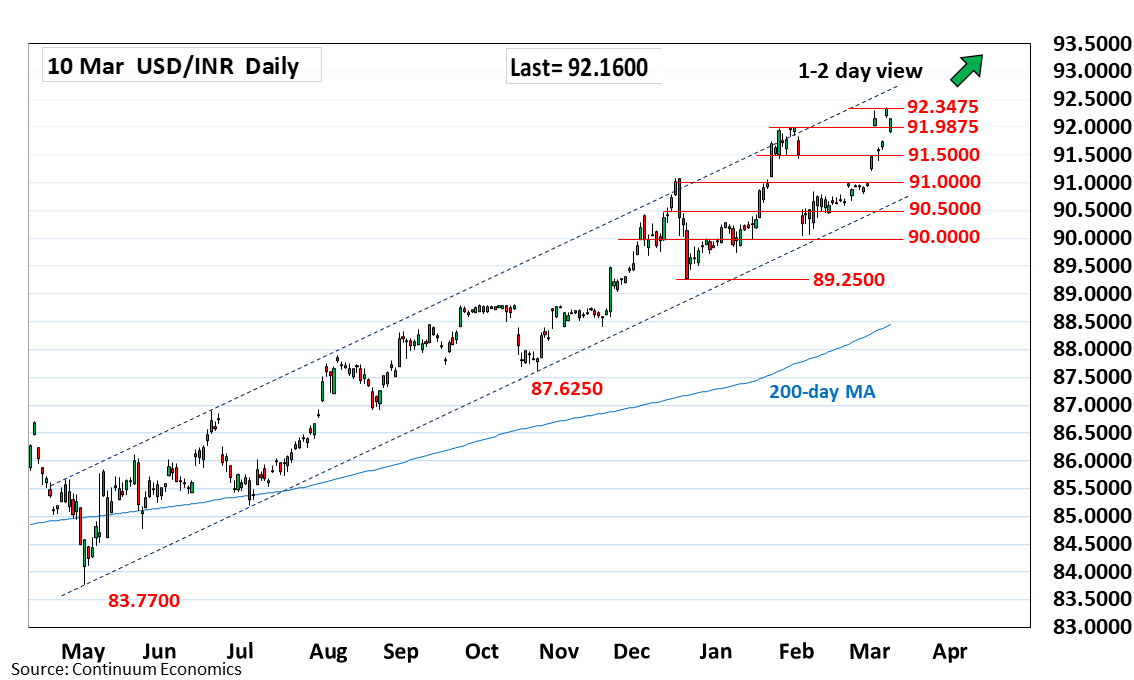
Settled back from the 92.3475 historic high as prices consolidate strong gains from the 90.0450, February low
| Level | Comment | Level | Comment | |||||
|---|---|---|---|---|---|---|---|---|
| R4 | 92.9000 | * | projection | S1 | 91.5000 | * | congestion | |
| R3 | 92.7800 | * | projection | S2 | 91.4025 | ** | 5 Mar low | |
| R2 | 92.5000 | * | projection | S3 | 91.0750 | ** | Dec 2025 year high | |
| R1 | 92.3475 | ** | 9 Mar all-time high | S4 | 90.5000 | * | congestion |
Asterisk denotes strength of level
05:00 GMT - Settled back from the 92.3475 historic high as prices consolidate strong gains from the 90.0450, February low. However, daily studies continues to track higher and suggest further gains cannot be ruled out. Break will extend the underlying bull trend and see room for extension to the 92.5000 projection target. Overbought daily studies caution corrective pullback with support now at the 91.5000/91.4025, congestion and 5 March low. Below this needed to ease the upside pressure and see room for deeper pullback to the 91.0750/91.0000 area.