Published: 2026-04-23T02:11:03.000Z
Chart USD/SGD Update: Extending corrective bounce
1
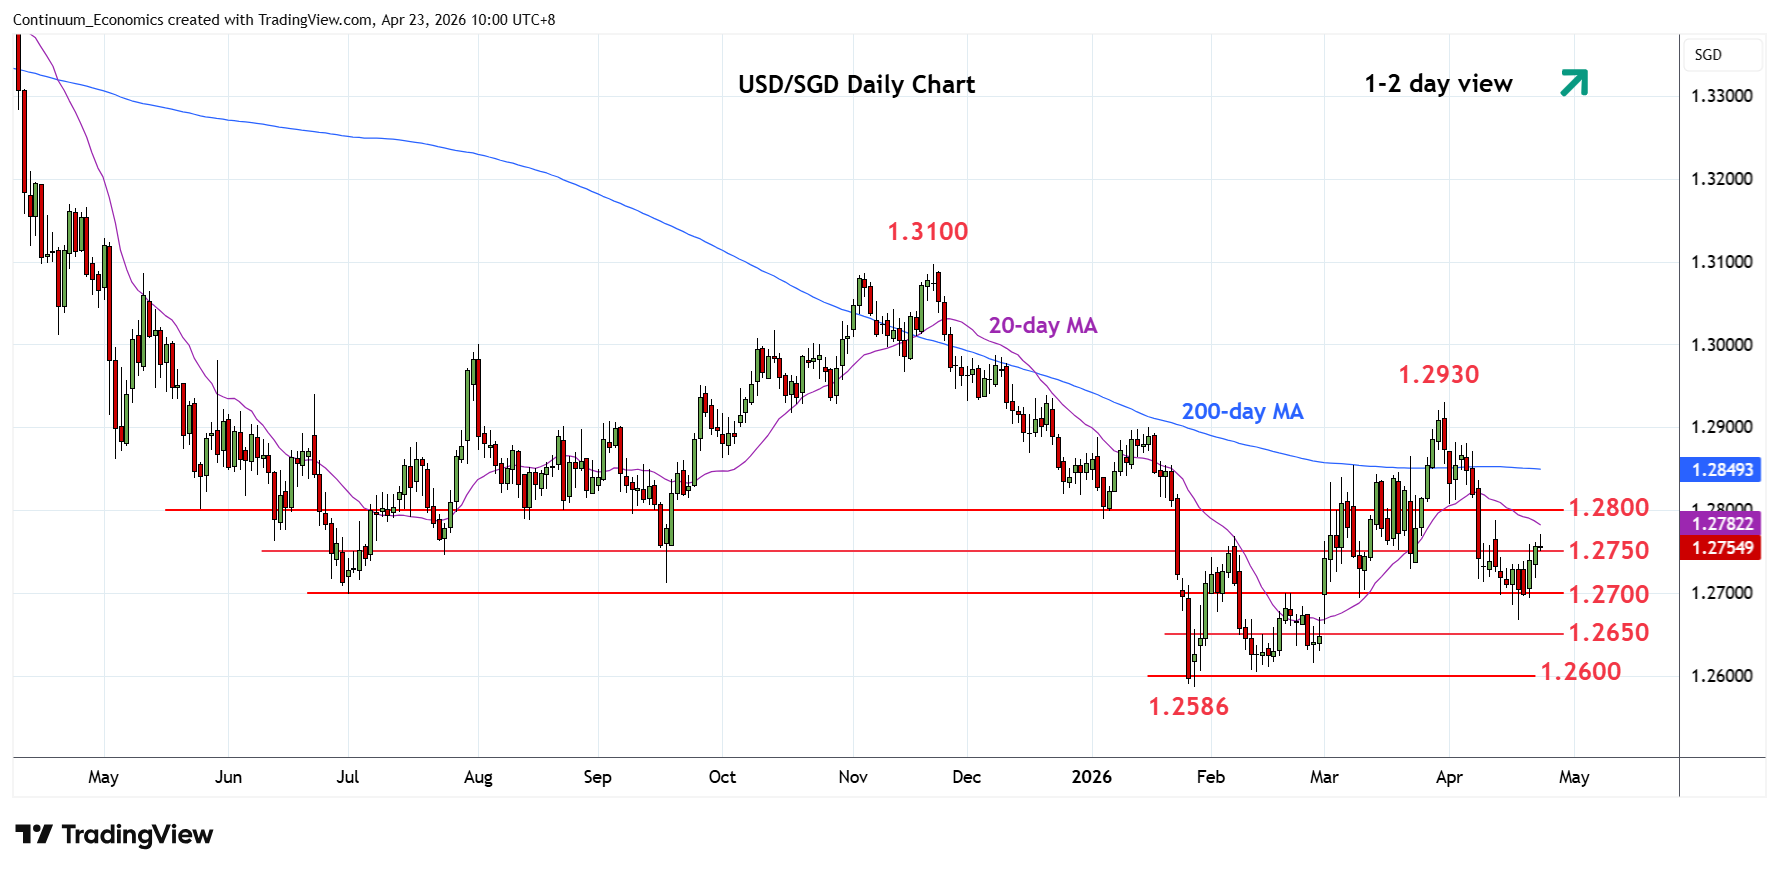
Higher to extend bounce from the 1.2670 low of last week
| Level | Comment | Level | Comment | ||||
|---|---|---|---|---|---|---|---|
| R4 | 1.2900 | * | Jan high | S1 | 1.2700 | ** | 19 Feb high, 2025 yr low |
| R3 | 1.2850 | * | congestion | S2 | 1.2650 | congestion | |
| R2 | 1.2800/07 | ** | congestion, 1 Apr low | S3 | 1.2600 | * | congestion |
| R1 | 1.2785 | * | 13 Apr high | S4 | 1.2586 | ** | 28 Jan YTD low |
Asterisk denotes strength of level
02:35 GMT - Higher to extend bounce from the 1.2670 low of last week. Break above resistance at the 1.2750 congestion see prices retracing losses from the 1.2930, 31 March current year high. Higher will see room resistance at 1.2785 then the 1.2800/07 area which is expected to cap and give way to renewed selling pressure later. Break of the 1.2700 level will see room to retest 1.2670 low then the 1.2650/1.2600 congestion area. Below the latter will expose the 1.2586 January current year low to retest and see room to extend the broader losses from the 2020 year high.