Published: 2026-01-28T05:54:18.000Z
Chart USD/IDR Updates: Extending losses
2
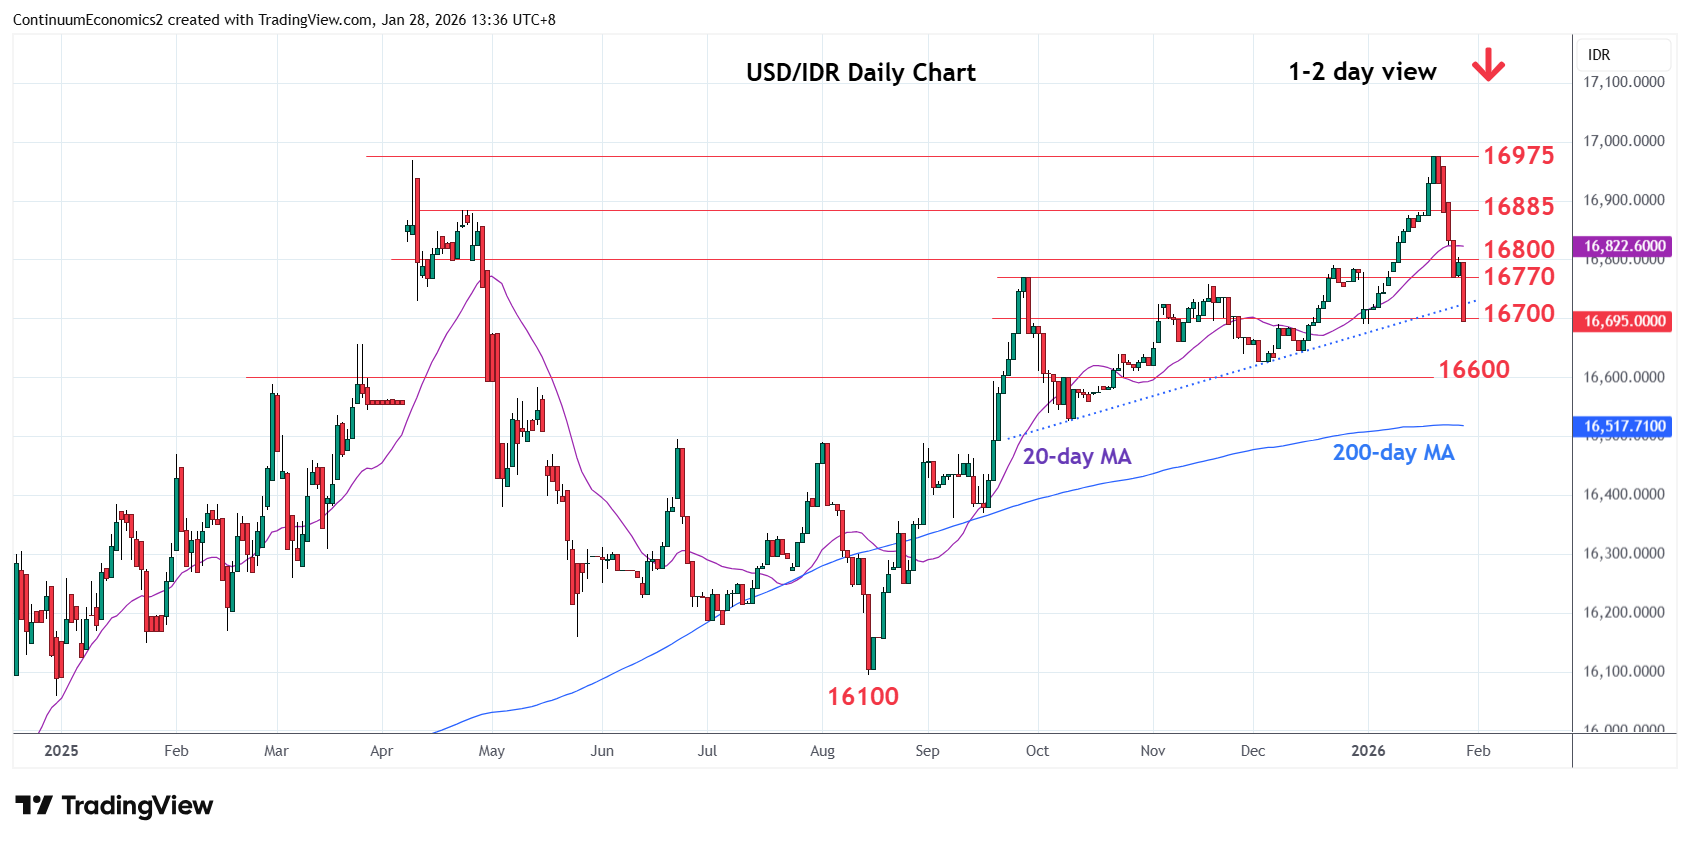
Consolidation at the 16770 support gave way to break to extend losses from the 16975 high to reach the 16700/16690 support
| Levels | Imp | Comment | Levels | Imp | Comment | |||
|---|---|---|---|---|---|---|---|---|
| R4 | 16975 | ** | 20 Jan all-time high | S1 | 16690 | ** | 31 Dec low | |
| R3 | 16885 | * | 23 Apr high | S2 | 16640 | * | 38.2% Aug/Jan rally | |
| R2 | 16800 | * | congestion | S3 | 16600 | * | congestion | |
| R1 | 16770 | ** | Sep high | S4 | 16525 | ** | Oct low |
Asterisk denotes strength of level
05:45 GMT - Consolidation at the 16770 support gave way to break to extend losses from the 16975 high to reach the 16700/16690 support. Oversold intraday and daily studies are stretched but any reaction here expected to give way to renewed selling pressure later. Lower will see room to the 16640, 38.2% Fibonacci level, then strong support at 16625/16600, December low and congestion area. Meanwhile, resistance is lowered to the 16770/16800, September high and congestion area, which should cap corrective bounce.