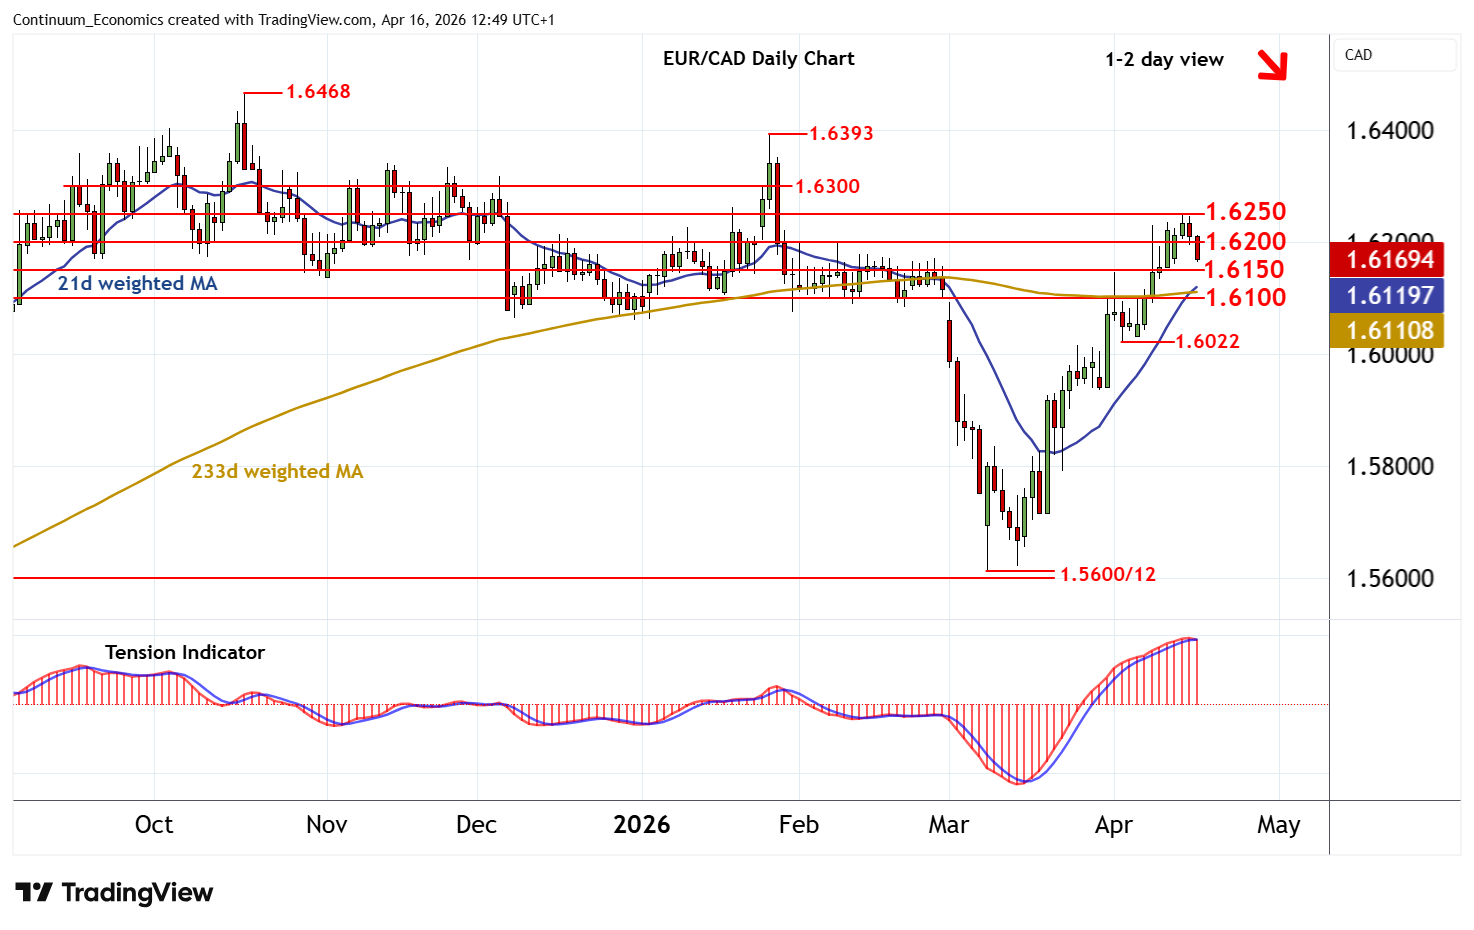
Chart EUR/CAD Update: Leaning lower
The test of congestion resistance at 1.6250 has been pushed back
| Level | Comment | Level | Comment | |||||
|---|---|---|---|---|---|---|---|---|
| R4 | 1.6393 | ** | 27 Jan YTD high | S1 | 1.6150 | * | congestion | |
| R3 | 1.6300 | * | congestion | S2 | 1.6100 | ** | break level | |
| R2 | 1.6250 | * | congestion | S3 | 1.6022/25 | * | 2-6 Apr lows | |
| R1 | 1.6200 | * | congestion | S4 | 1.6000 | * | break level |
Asterisk denotes strength
12:20 BST - The test of congestion resistance at 1.6250 has been pushed back, as intraday studies turn down, with prices currently trading around 1.6175. Overbought daily stochastics are unwinding and the daily Tension Indicator is also turning down, highlighting room for further losses in the coming sessions. A break below congestion support at 1.6150 will open up 1.6100. But rising weekly charts should limit any initial tests of here in renewed buying interest/consolidation. Meanwhile, a close back above congestion resistance at 1.6200 would help to stabilise price action. But a further close above 1.6250 is needed to turn sentiment positive and extend early March gains towards further congestion around 1.6300.